Manage a VPS/VDS server in the DCHost portal
Open the service page for your VPS/VDS to view its resources and management options. This guide explains the overview, storage, network, monitoring and template sections and which screen to use for each task.
Before you start: Sign in to the customer portal and select the correct account and project. Screenshot resources and quotas belong to the example service; use the values shown for your own service. No server settings were changed and no backups or snapshots were created for this guide.
Open the server's service page
- Find the project containing your server under Your Projects on the dashboard.
- Open Manage Project, then choose VPS from the project menu.
- Open the server you want to manage. Check its service name and resources before taking an action.
If you have several projects, an empty VPS list does not show services in the others. Use the project management and service lists guides if you cannot find the service.
VPS Overview: check resources and status
VPS Overview shows summary information for the selected server. The example service displays 1 CPU, 2 GB memory, 40 GB disk and Ubuntu 24.04. These values are not the specifications of every VPS/VDS plan.
Open the server overview and find storage and network screens in the sidebar.
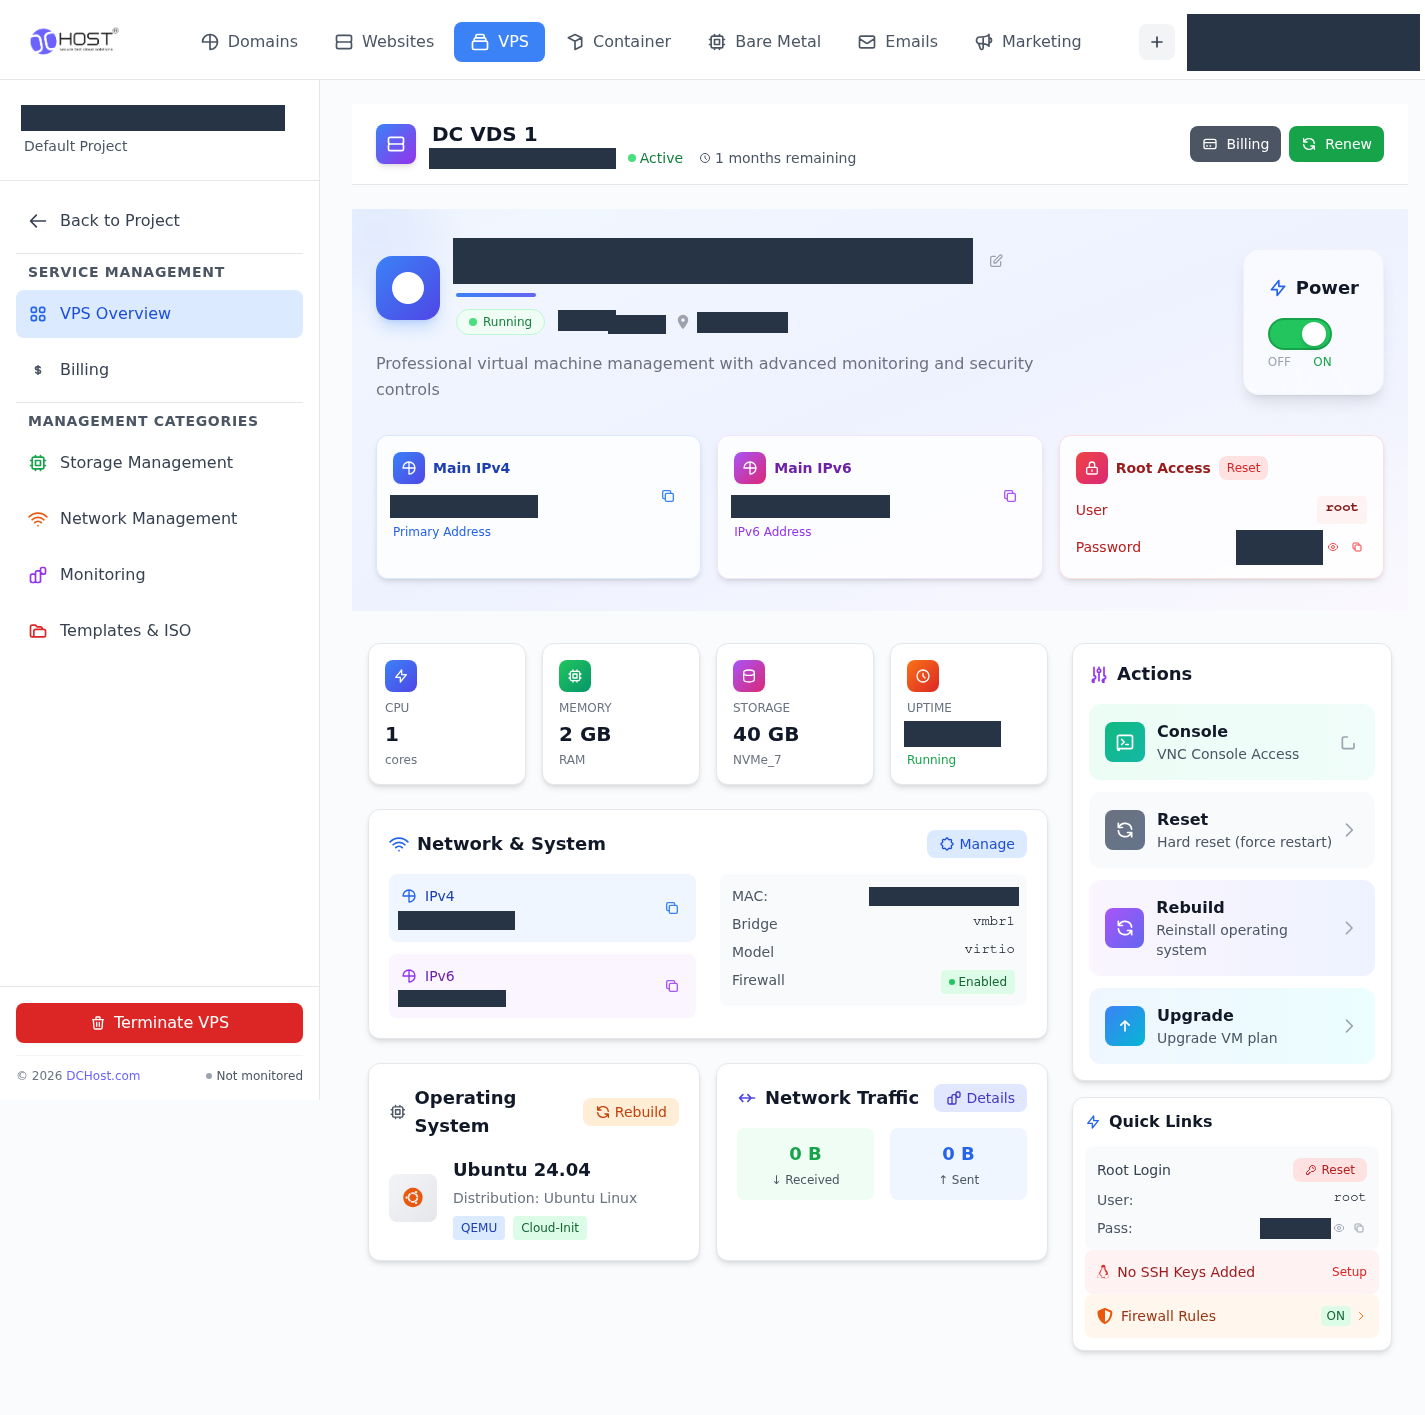
Step 1: Open the server overview
- Open the server overview
VPS Overview shows resources and status information for the selected server.
- Find storage management
Use Storage Management for disks, backups and snapshots.
- Find network management
Use Network Management for interfaces, firewall and reverse DNS.
- Open the console in a separate window
Console — VNC Console Access opens the operating-system console. Check the connection state and authentication result separately.
Allow status fields to update and check the server connection separately.
Check service status and server availability separately. Status fields may update at different times: the example service initially showed Offline / Stopped under Uptime, then updated to Running on a subsequent load, matching the virtual machine status. Allow for this display delay and check operating system or application access separately from the status labels.
If your screen shows a similar inconsistency, refresh the page, read the status again and check the server connection separately. If you cannot connect, include the displayed statuses and the time in a support request. For resource usage inside the operating system, see server resource checks.
Console: open the operating-system login screen
VPS Overview → Console — VNC Console Access opens the server console in a separate window. Use your server username and password at the operating-system login screen.
Enter the username at login:, then enter the server password at the Password: prompt.
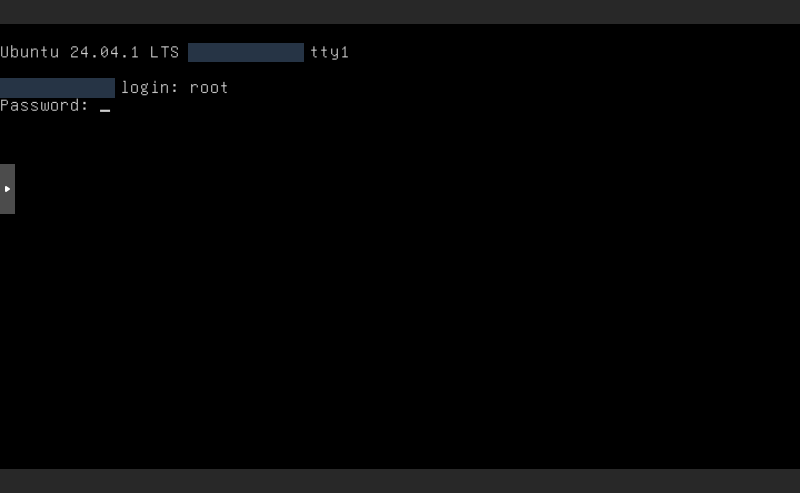
Step 1: Check the login line containing the username
- Check the login line containing the username
The login: prompt requests the username. The example uses root as shown on the service page.
- Enter the password only at the Password prompt
Characters normally remain invisible at Password:. Do not enter a password while a shell command prompt is active.
The hostname is masked. Password characters remain hidden while you type.
- Find the server username under Root Access → User on the service page.
- Enter that username at the login: prompt and press Enter.
- Enter the server password at the Password: prompt and press Enter. Password characters normally remain invisible as you type.
Keep your server credentials separate from your customer portal account details. Enter the password only where requested, never at a shell command prompt or in a support message.
To connect over SSH, use the password or SSH key authentication configured for your service. Continue with first Linux server login, SSH key sign-in or SSH connection checks.
Storage Management: disks, backups and snapshots
Open Storage Management on the server page. Disk information, backups and snapshot records have separate tabs.
Disk Management
Use Disk Management to review the service's disk information. The 40 GB disk value on the overview is the plan capacity; it does not represent free space inside the operating system. Check filesystem usage separately using the disk steps in server resource checks.
Review disk capacity and the related management links.
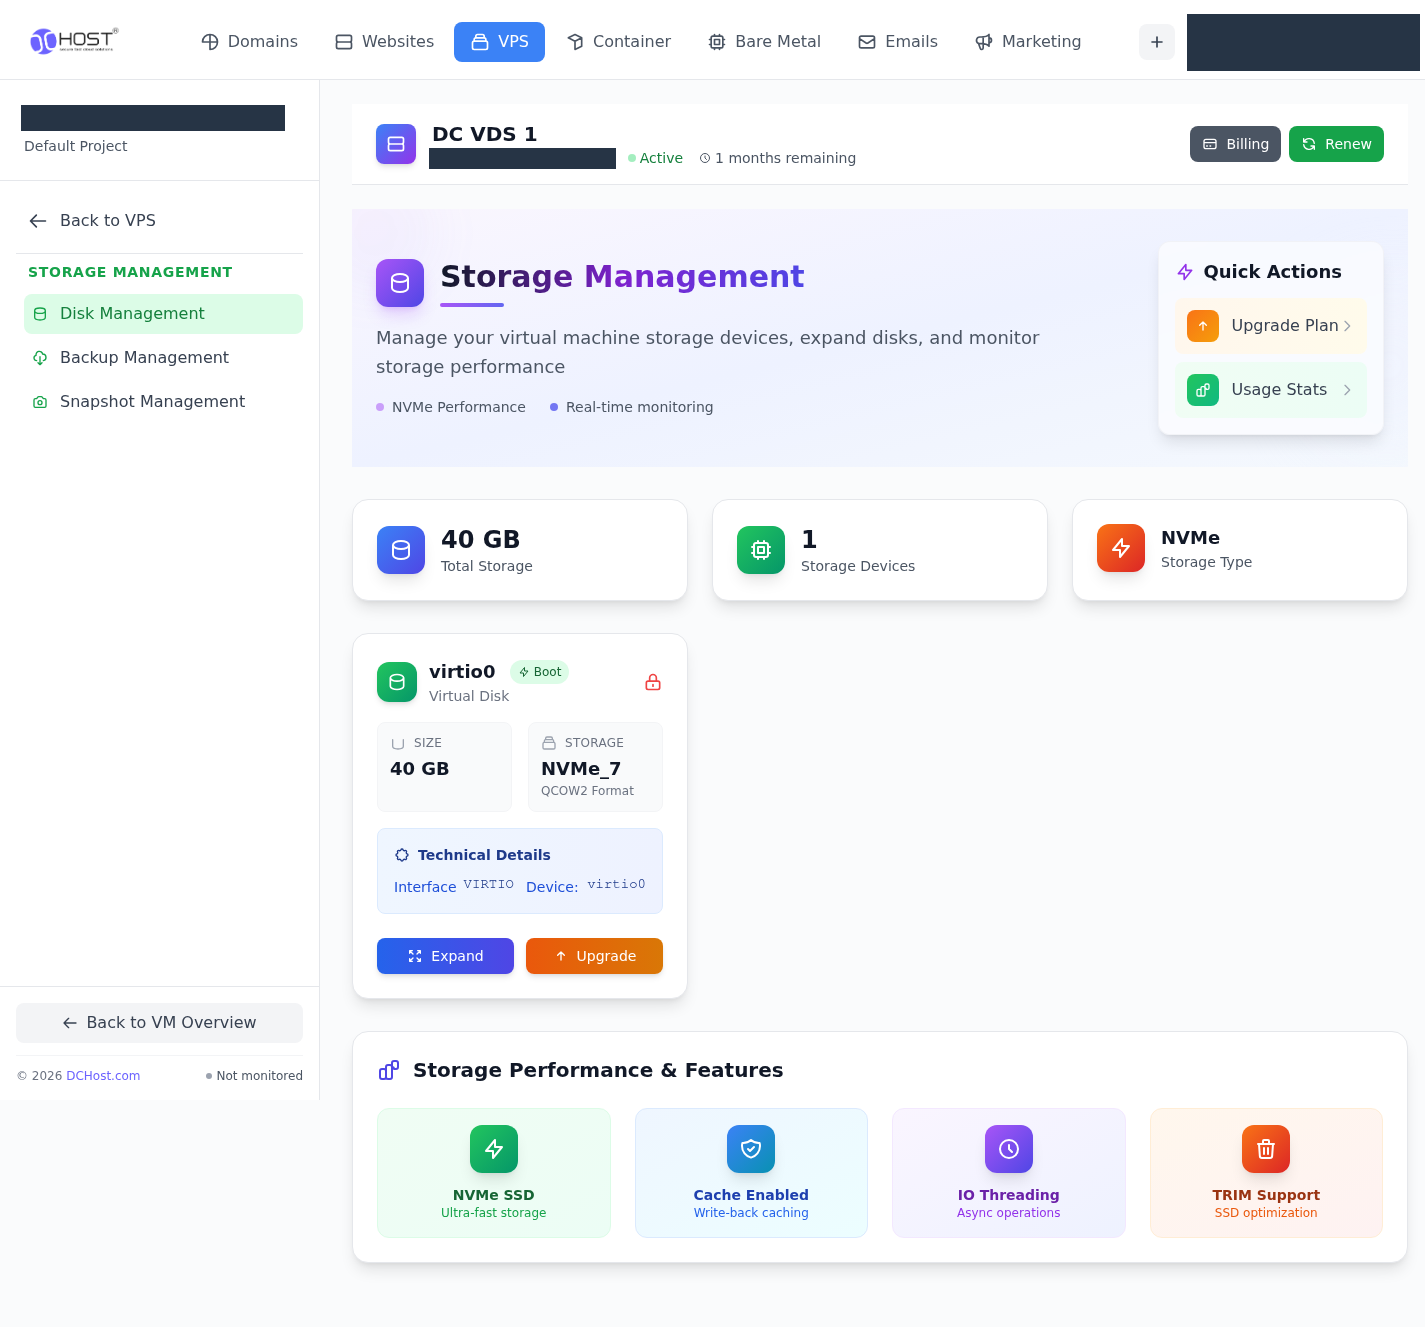
Step 1: Select the disk screen
- Select the disk screen
Disk Management in the sidebar opens disk information.
- Locate usage statistics
Usage Stats is in the action area on the right. Distinguish capacity from usage.
Plan capacity is not the amount of free space inside the operating system.
Backup Management and Backup Schedule
Use Backup Management to review the service's backup area. The example service shows 0 backup slots and indicates that a plan upgrade is required to use backups.
The example service has no backup slots and the screen requires an upgrade.
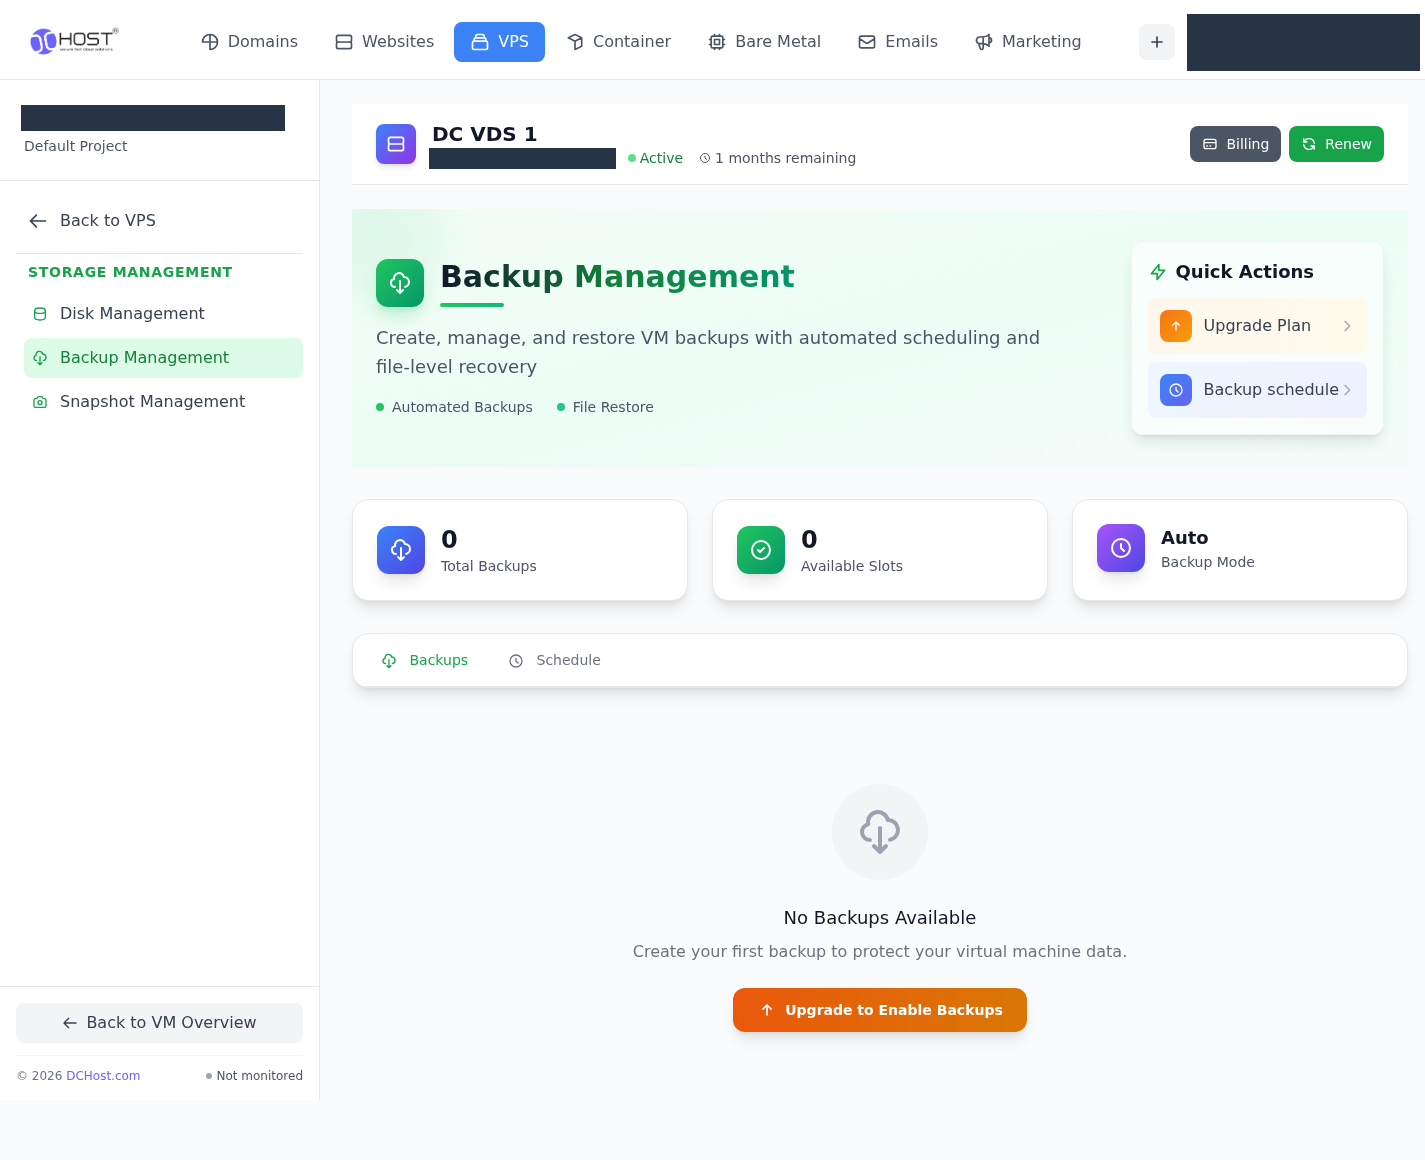
Step 1: Open backup management
- Open backup management
Check your service backup quota and records under Backup Management.
- Find backup scheduling
Backup schedule opens the schedule list.
Review upgrade terms. No backup was created and no upgrade request was submitted for this guide.
The Backup Schedule list is also empty. With no backup slots on this service, schedule creation controls are not shown.
The example service has no backup quota and shows no schedule creation control.
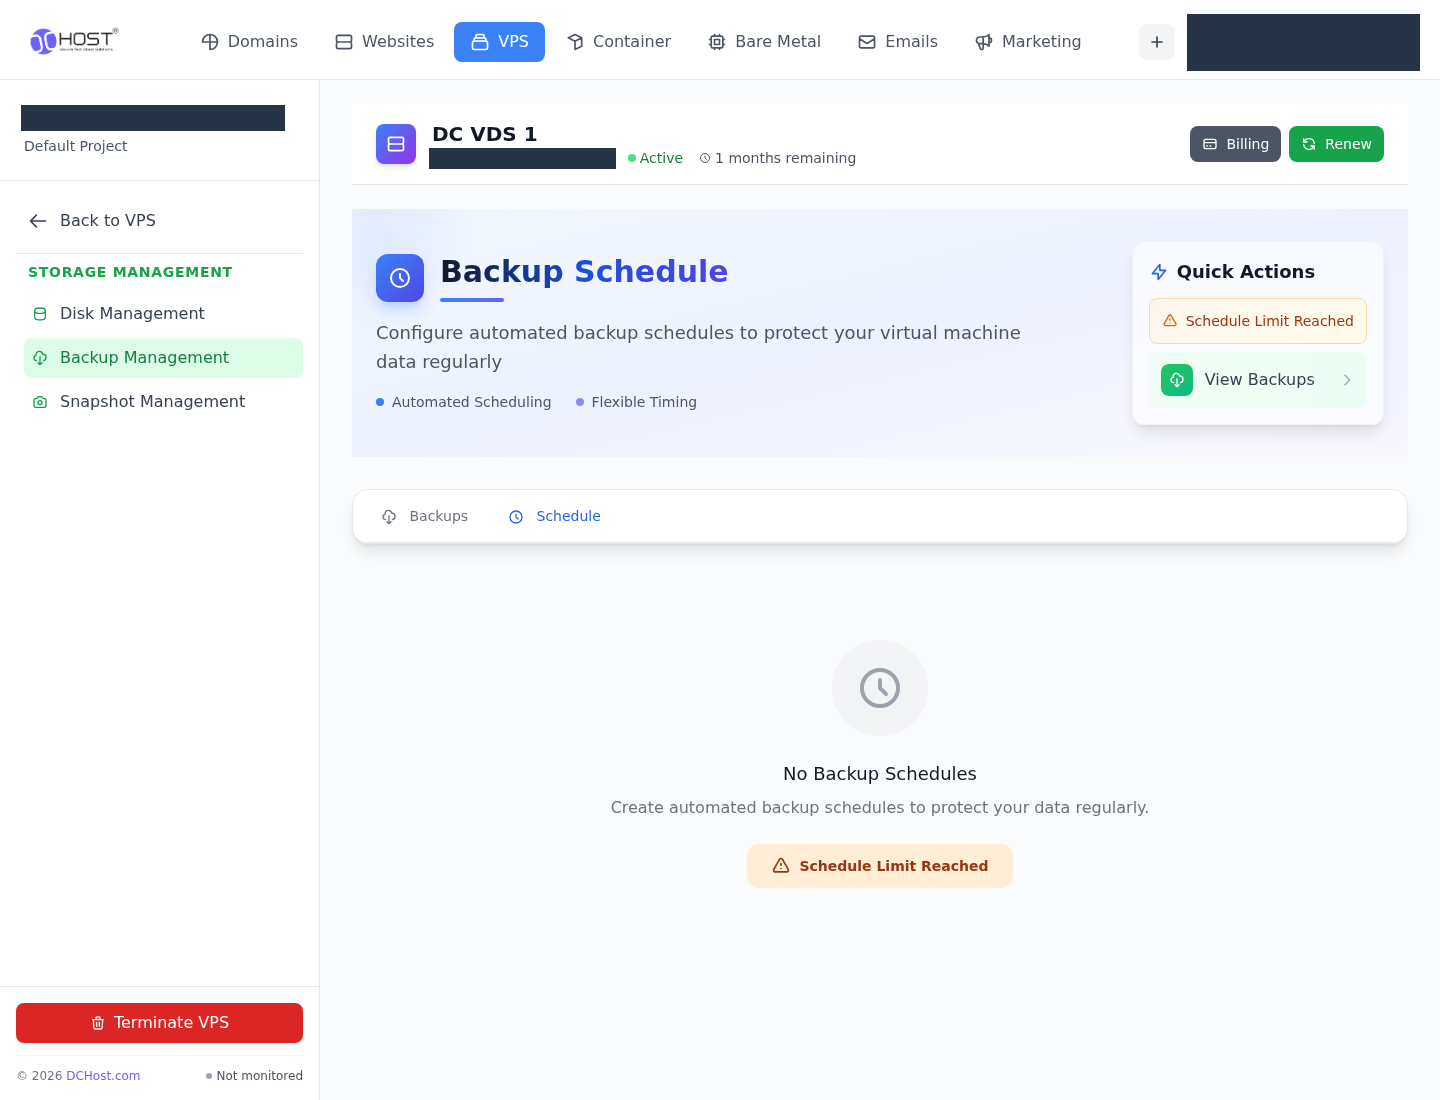
Step 1: Check the Schedule tab
- Check the Schedule tab
Schedule lists existing backup schedules; the example list is empty.
- Return to the backup list
Use View Backups to review backup records and your service quota.
An empty schedule list does not establish that a backup completed.
If no quota is available, review the upgrade terms. Upgrade / Downgrade includes Resource upgrades and Scale VM Packade sections with Continue controls; no upgrade request was submitted for this guide. Contact support if the backup option's scope is unclear. Use the server backup plan for planning and restore verification to check an existing backup.
Review Resource upgrades, Scale VM Packade and the displayed summary amounts.
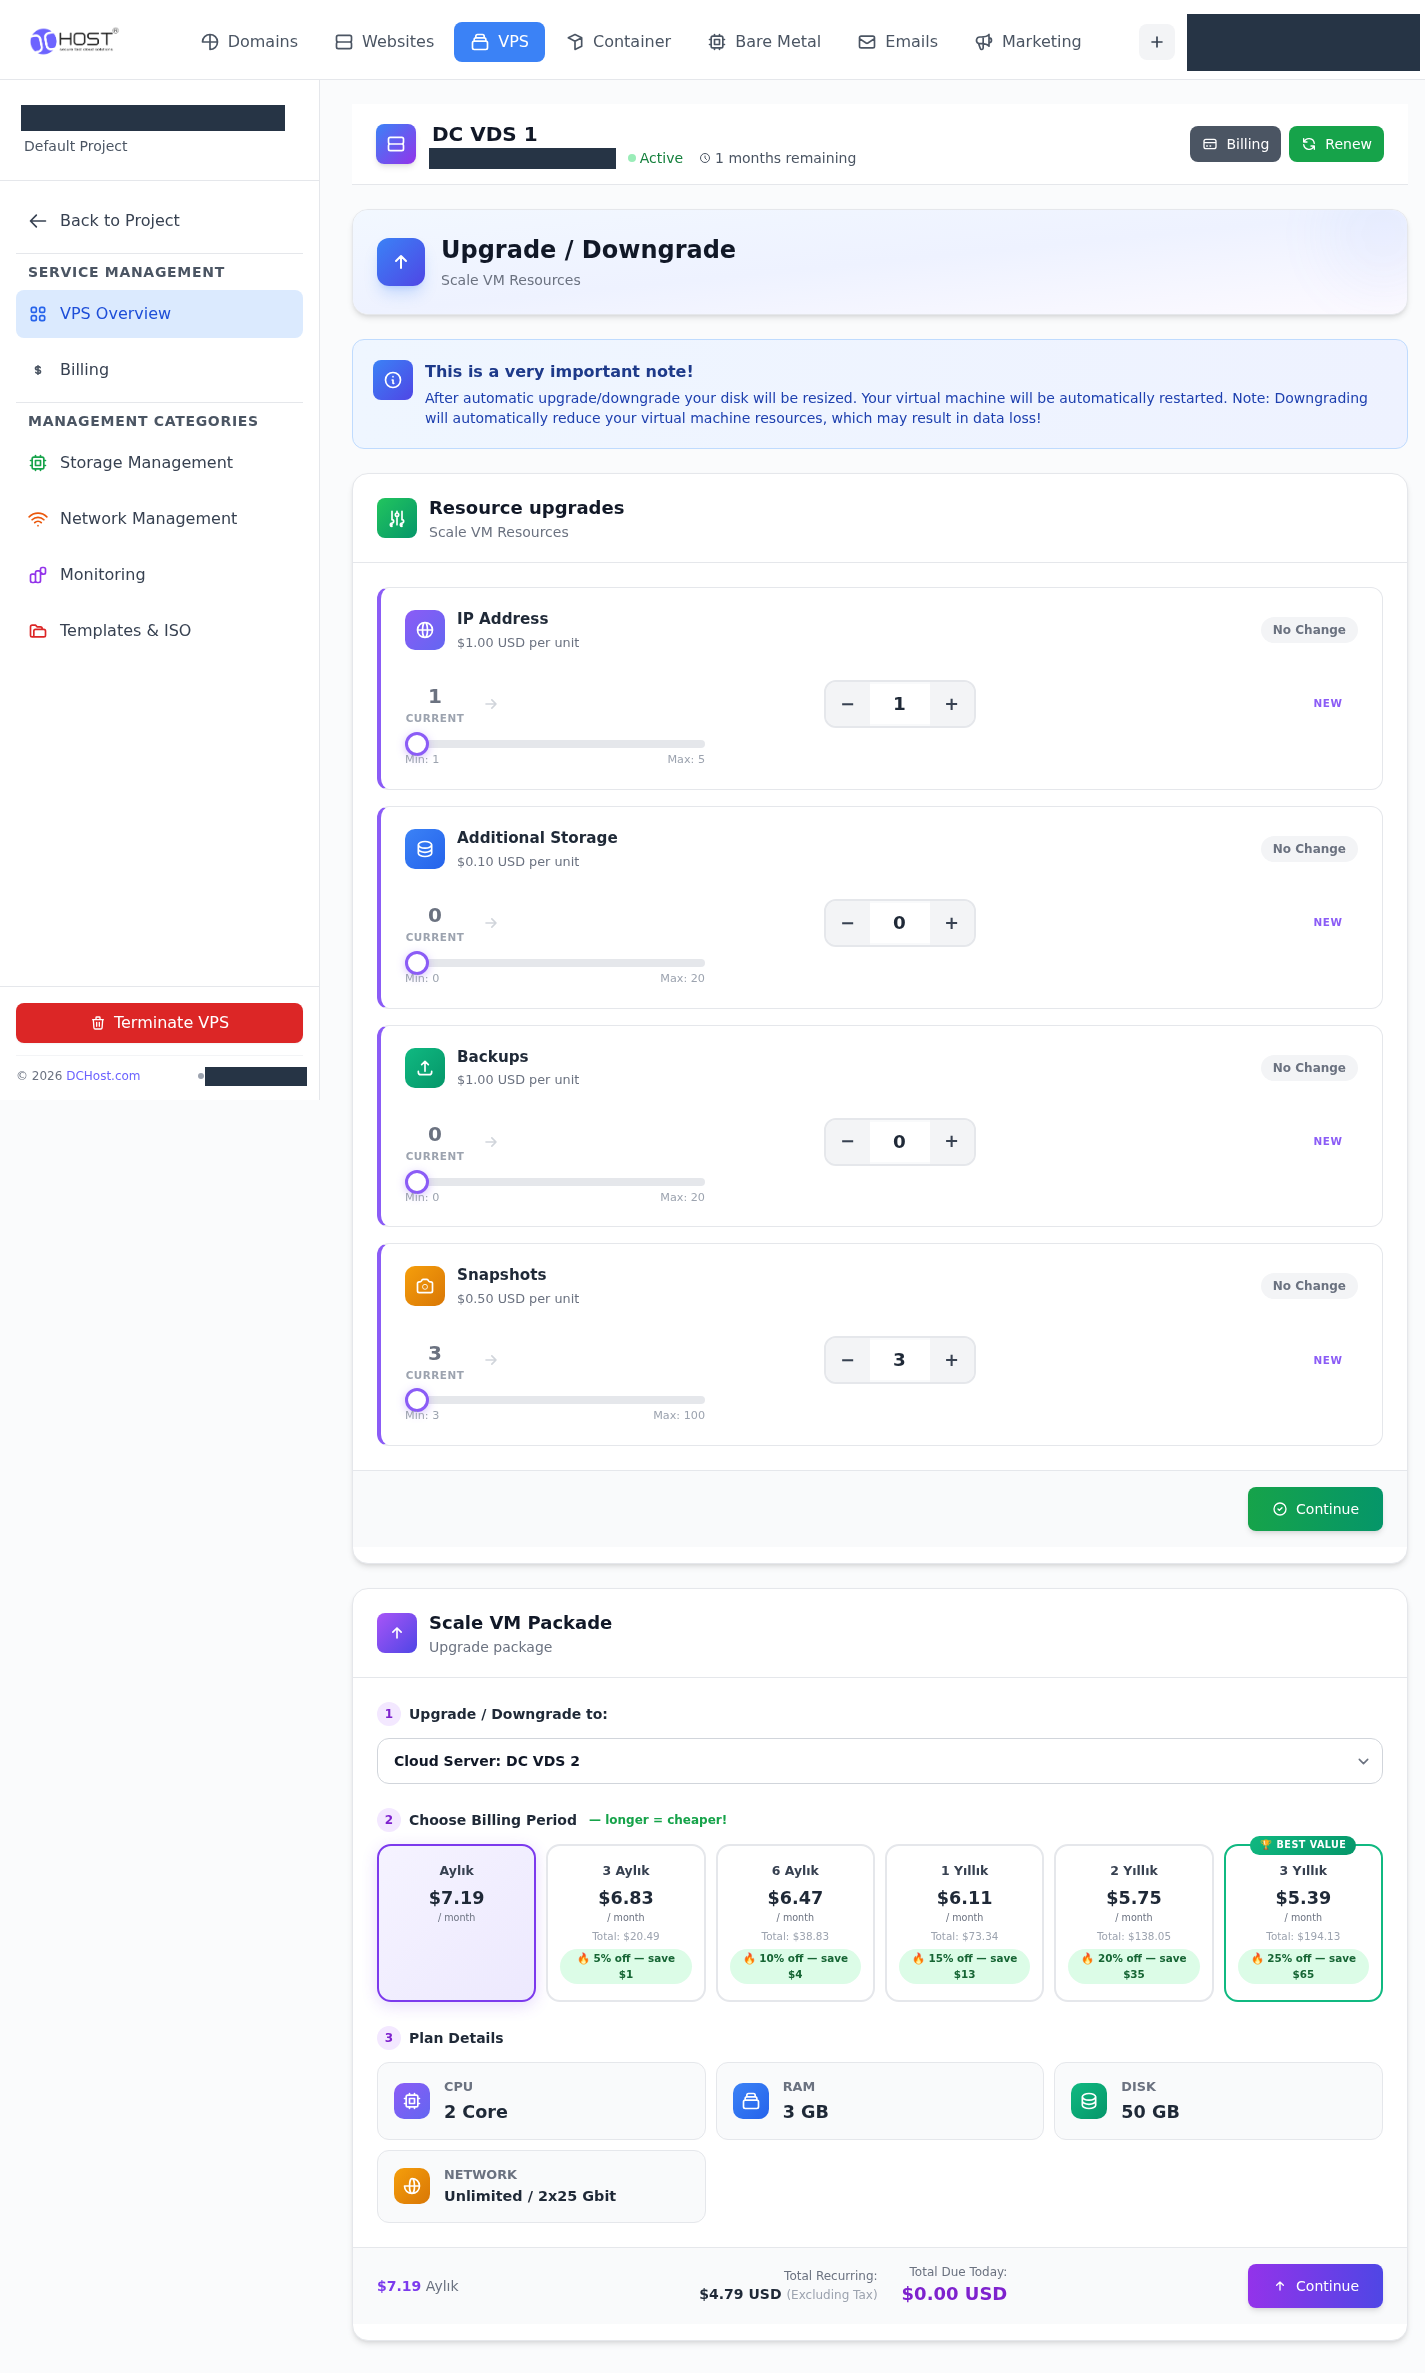
Step 1: Check the plan and period
- Check the plan and period
Read the plan in Upgrade / Downgrade to together with the billing period shown below it.
- Stop if the summary is inconsistent
If Total Recurring and Total Due Today do not match the selected plan and period, do not use Continue; ask support to confirm.
The example period price and footer summary differ. Continue was not used and no upgrade request was submitted.
The example preview shows different prices on the selected plan card and the Total Recurring summary. If your totals disagree, stop before Continue and ask support to confirm the price. No purchase was submitted from this screen.
Snapshot Management and Snapshot Schedule
Snapshot Management shows snapshot records for the server. The example service has no records and displays 3 available slots and Create Snapshot. An available slot is not an existing snapshot; check the used and available capacity on your own service.
The example service has no snapshot records and shows three available slots.
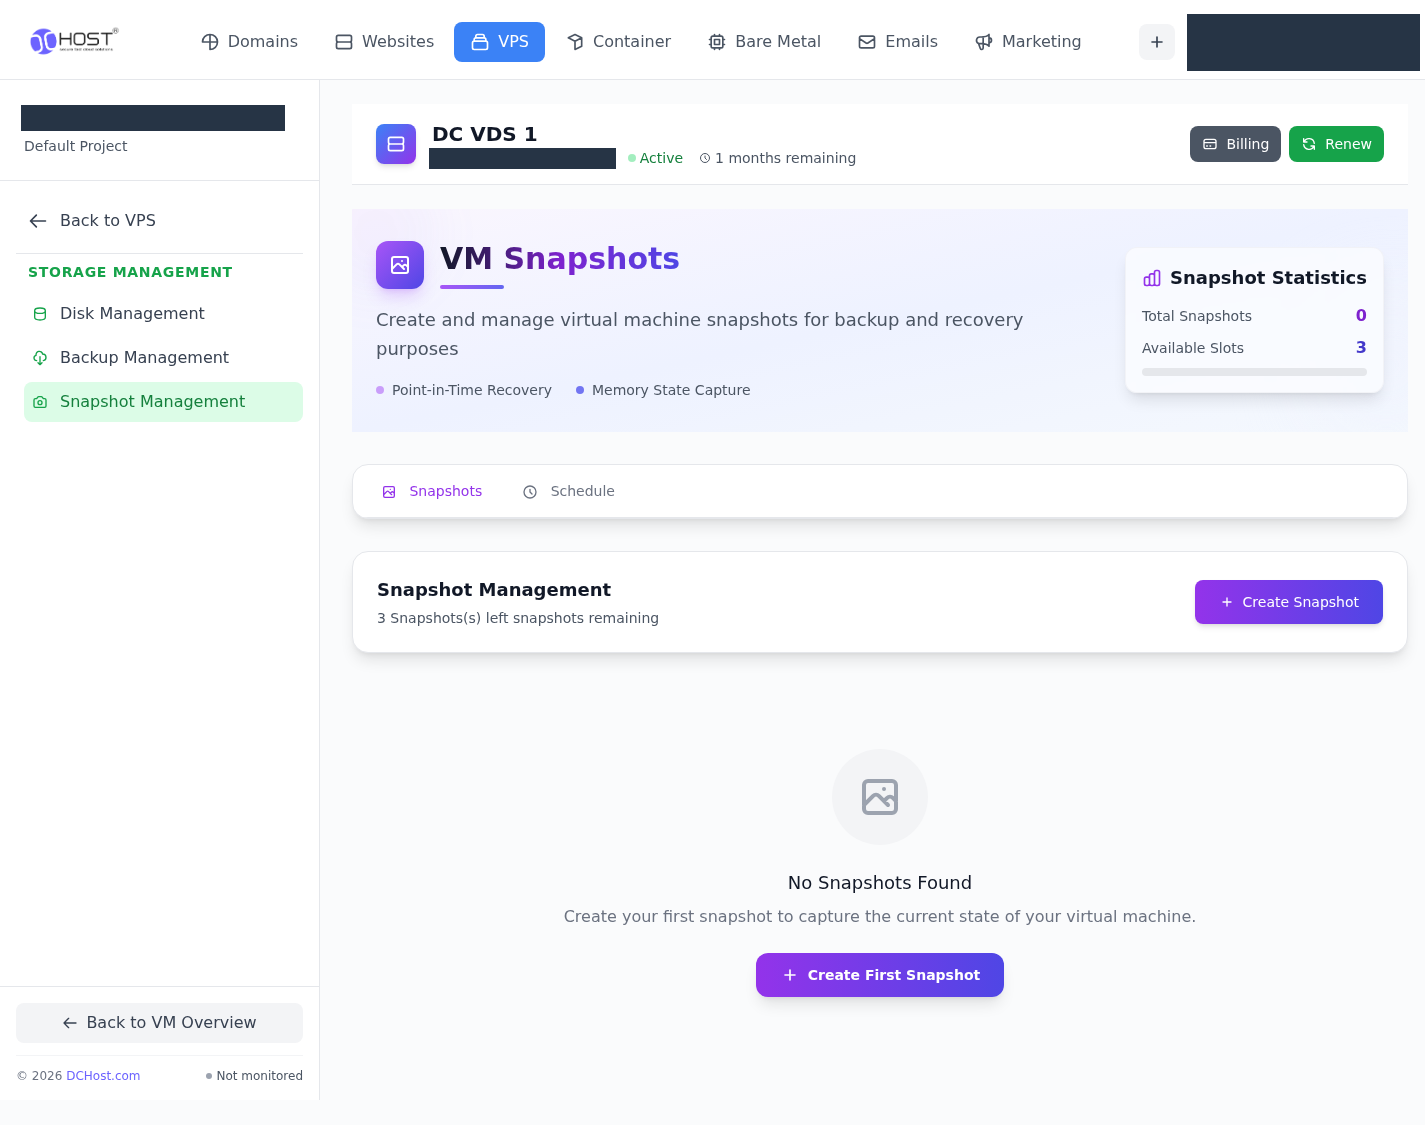
Step 1: Locate the create control
- Locate the create control
Create Snapshot is available here. Review your service capacity and retention terms first.
- View schedules
The Schedule tab opens snapshot schedules.
Create Snapshot was not used. Maintain an independent backup plan alongside snapshots.
The Snapshot Schedule list is empty and shows New Schedule and Create First Schedule. No snapshot or schedule was created for this guide.
The example list is empty and schedule creation controls are visible.
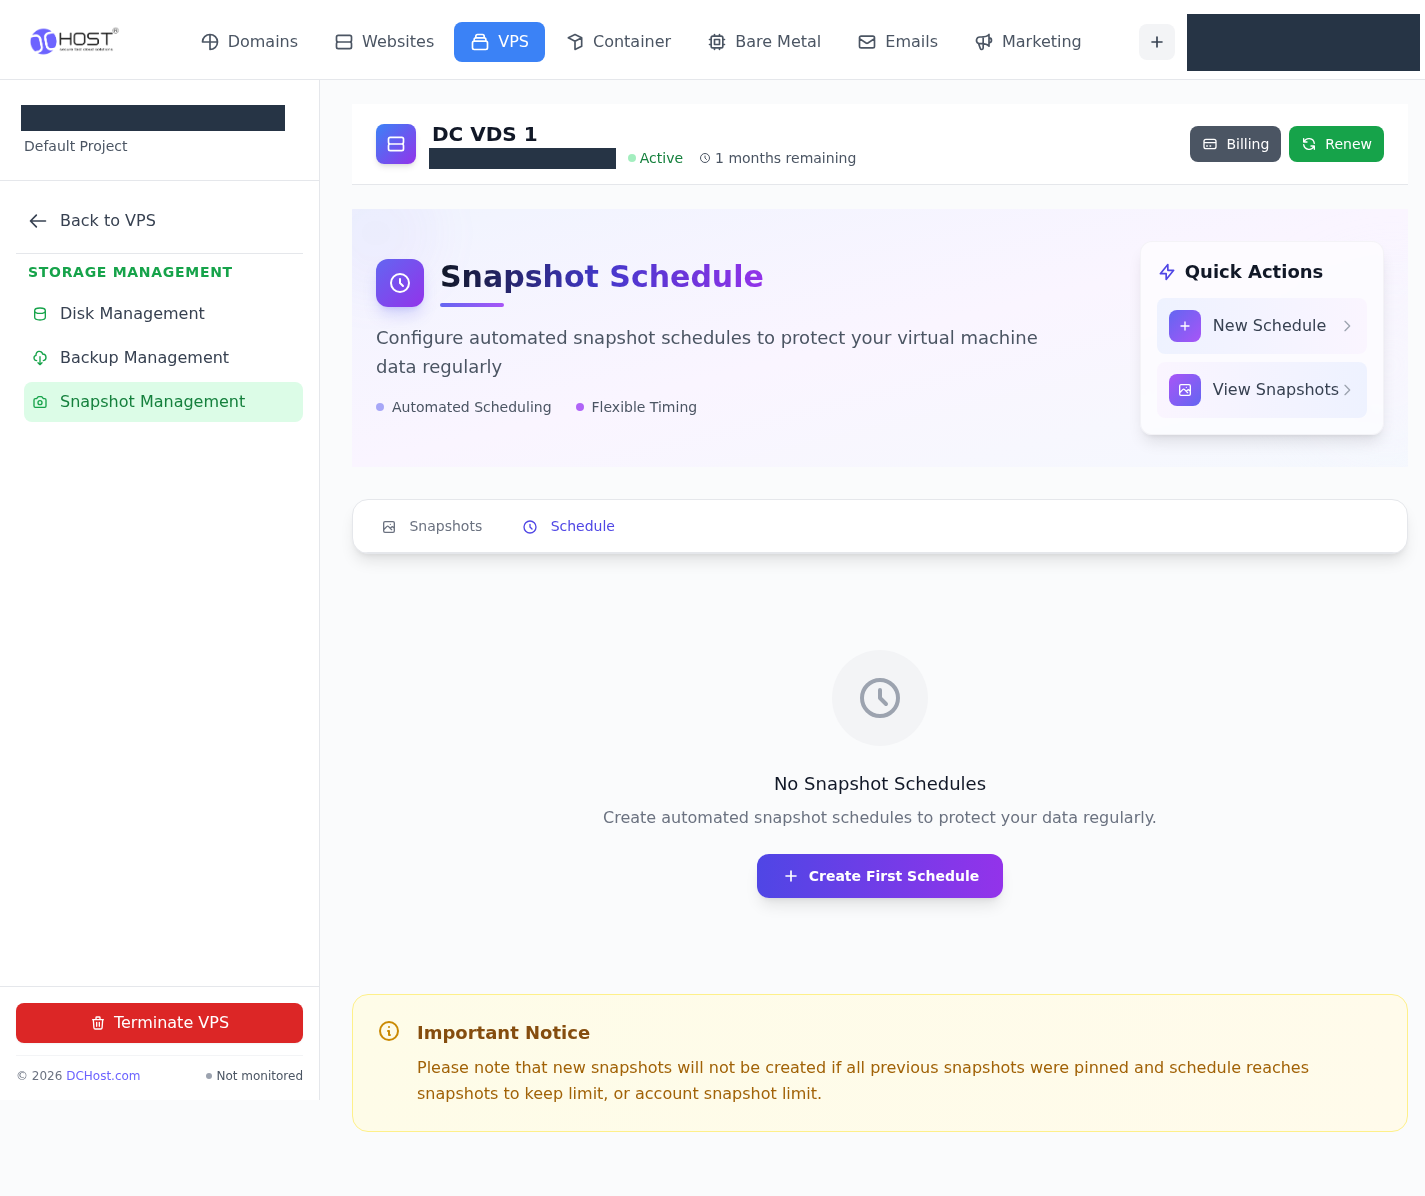
Step 1: Select the schedule tab
- Select the schedule tab
Review existing snapshot schedules in the Schedule tab.
- Locate the new schedule control
New Schedule appears at the top and Create First Schedule in the empty list. Neither was used for this guide.
Important Notice: new snapshots cannot be taken when all previous snapshots are pinned and the retention or account limit is reached.
A snapshot stores server state at a particular point in time. Review capacity and retention terms before creating one. Also maintain a backup plan with copies stored independently of the server and verified restores.
Network Management: choose the appropriate screen
Open Network Management on the server page. This section includes links to network interfaces, firewall and reverse DNS.
| What you want to check | Section to open |
|---|---|
| Server network interfaces | Network Interfaces |
| Firewall rules | Firewall Rules |
| Firewall options | Firewall Rules → Options |
| Firewall logs | Firewall Rules → View Logs |
| IP addresses assigned to the service | Network Interfaces |
| Reverse DNS information for an IP address | Reverse DNS |
Network Interfaces
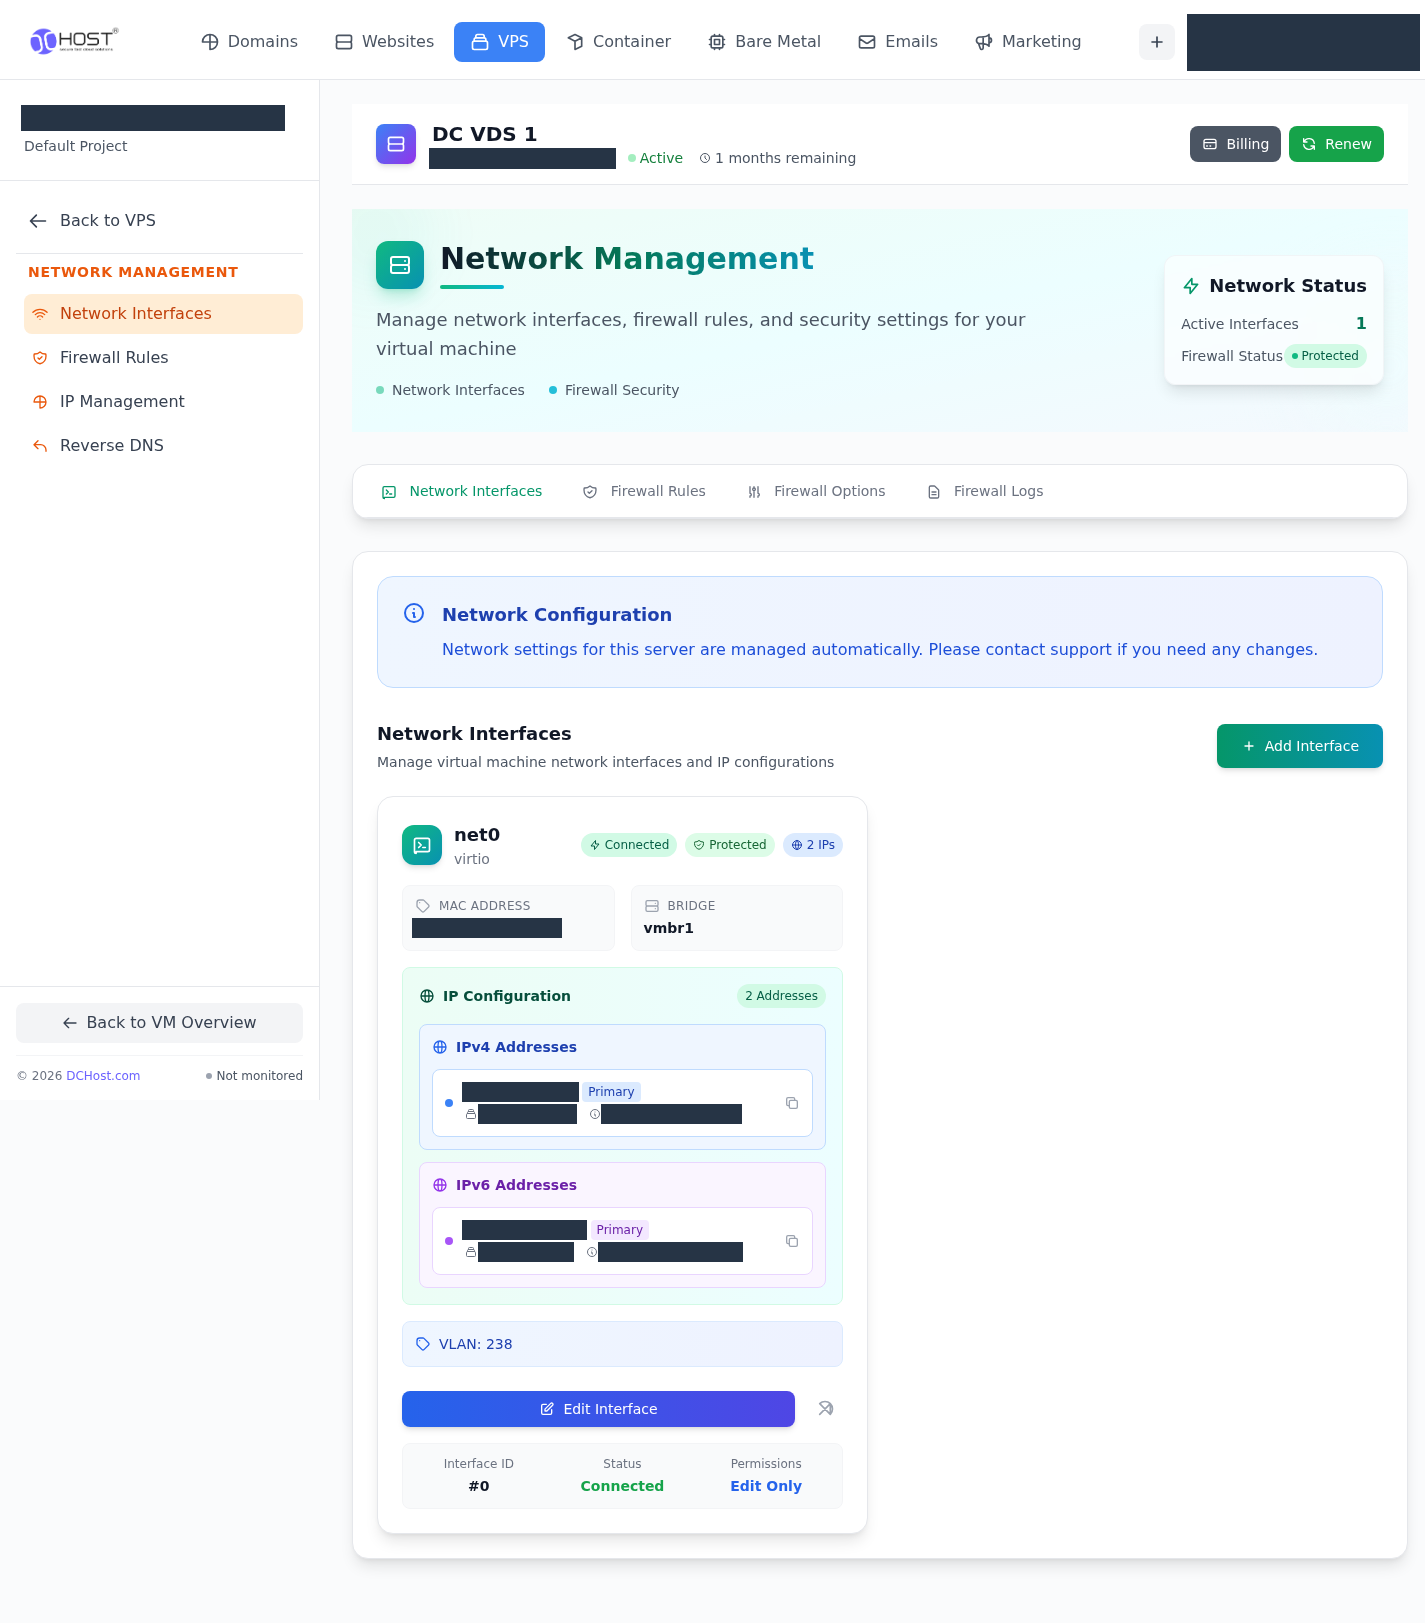
Use Network Interfaces to check the server's network interfaces and assigned IP addresses. The example service shows one connected net0 interface, 2 IP addresses and Protected status. Compare the address you intend to connect to with the information here. These details do not by themselves verify the operating system's network configuration or internet connectivity.
The example service shows one connected net0 interface, two IP addresses and Protected status.
Step 1: Open network interfaces
- Open network interfaces
Network Interfaces shows assigned addresses and interface information.
- Find the firewall rules link
Use Firewall Rules to open firewall rules.
Networking is managed automatically. Follow the support guidance for changes even though Add Interface and Edit Interface are visible.
The screen's notice says the network is managed automatically and directs you to contact support for changes. Although Add Interface and Edit Interface controls are visible, follow that guidance when requesting network changes.
If you plan to point a domain to this server, use your own service's address in its DNS record. An IP address appearing in the portal does not automatically change your domain's DNS records. For domain pointing, see A and AAAA records in the DNS records guide.
Firewall Rules, Options and View Logs
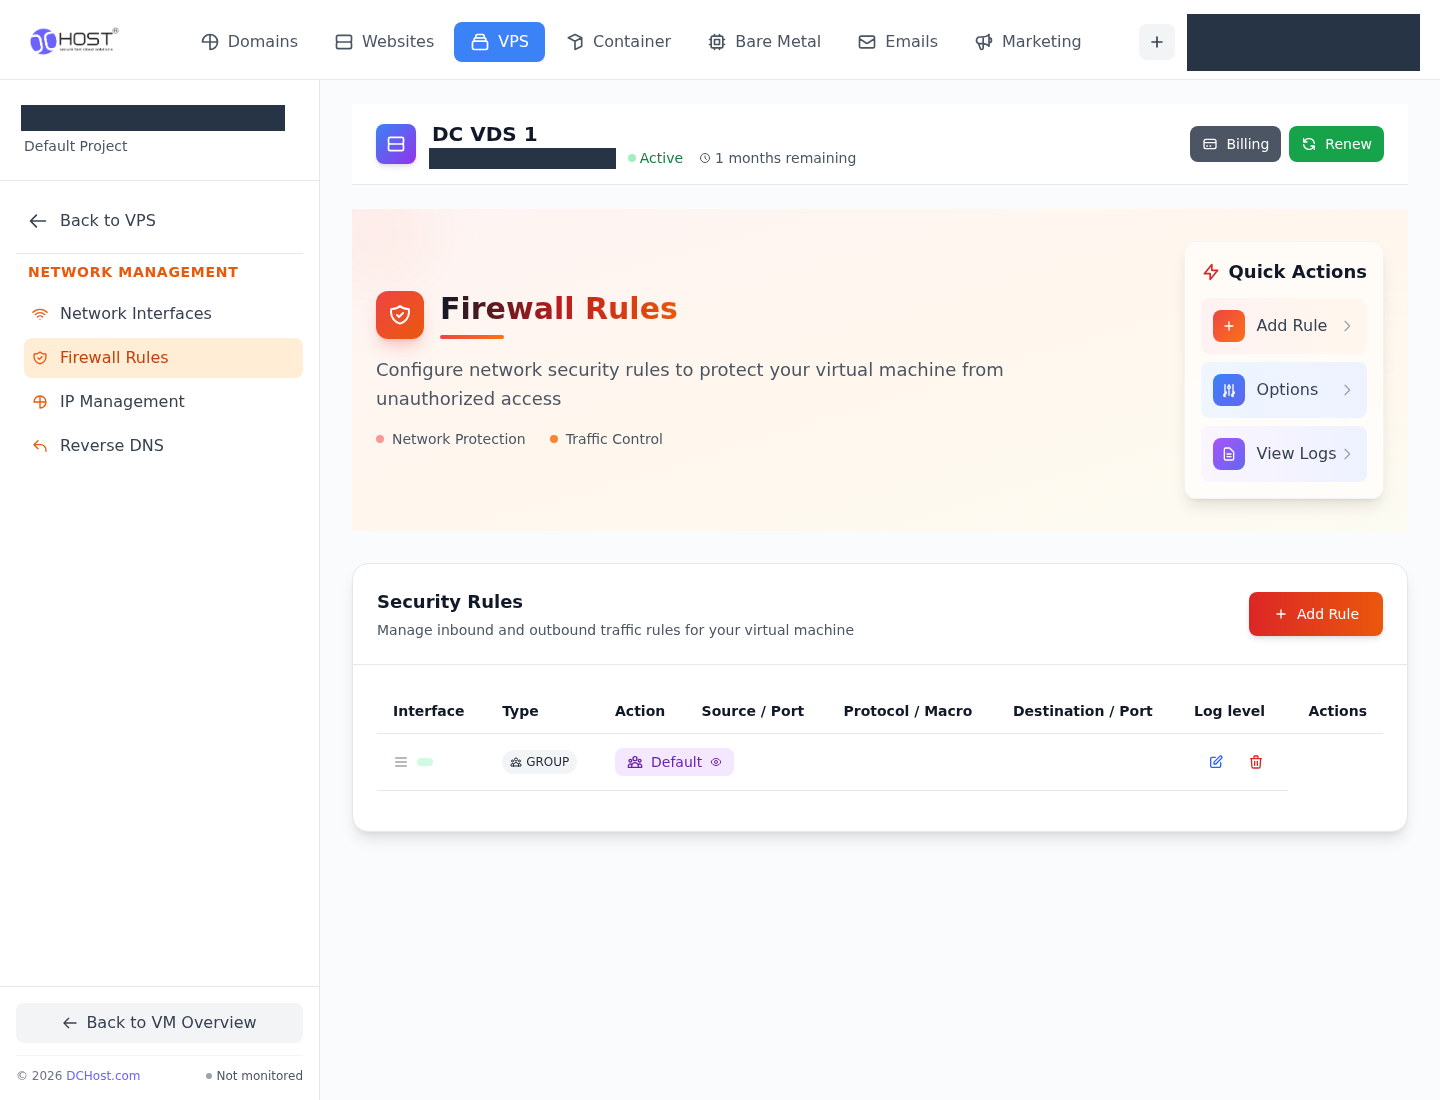
Open Network Management → Firewall Rules. When investigating a connection problem, identify the destination service's port, protocol and source addresses that require access. Check the portal firewall together with the operating system's firewall.
Review rules, global options and firewall logs separately.
Step 1: Select the rules screen
- Select the rules screen
Firewall Rules under Network Management opens this screen.
- Open options
Options shows global firewall and logging settings.
- Open firewall logs
Use View Logs to inspect firewall records.
Add Rule was not used; no rules were added or deleted for this guide.
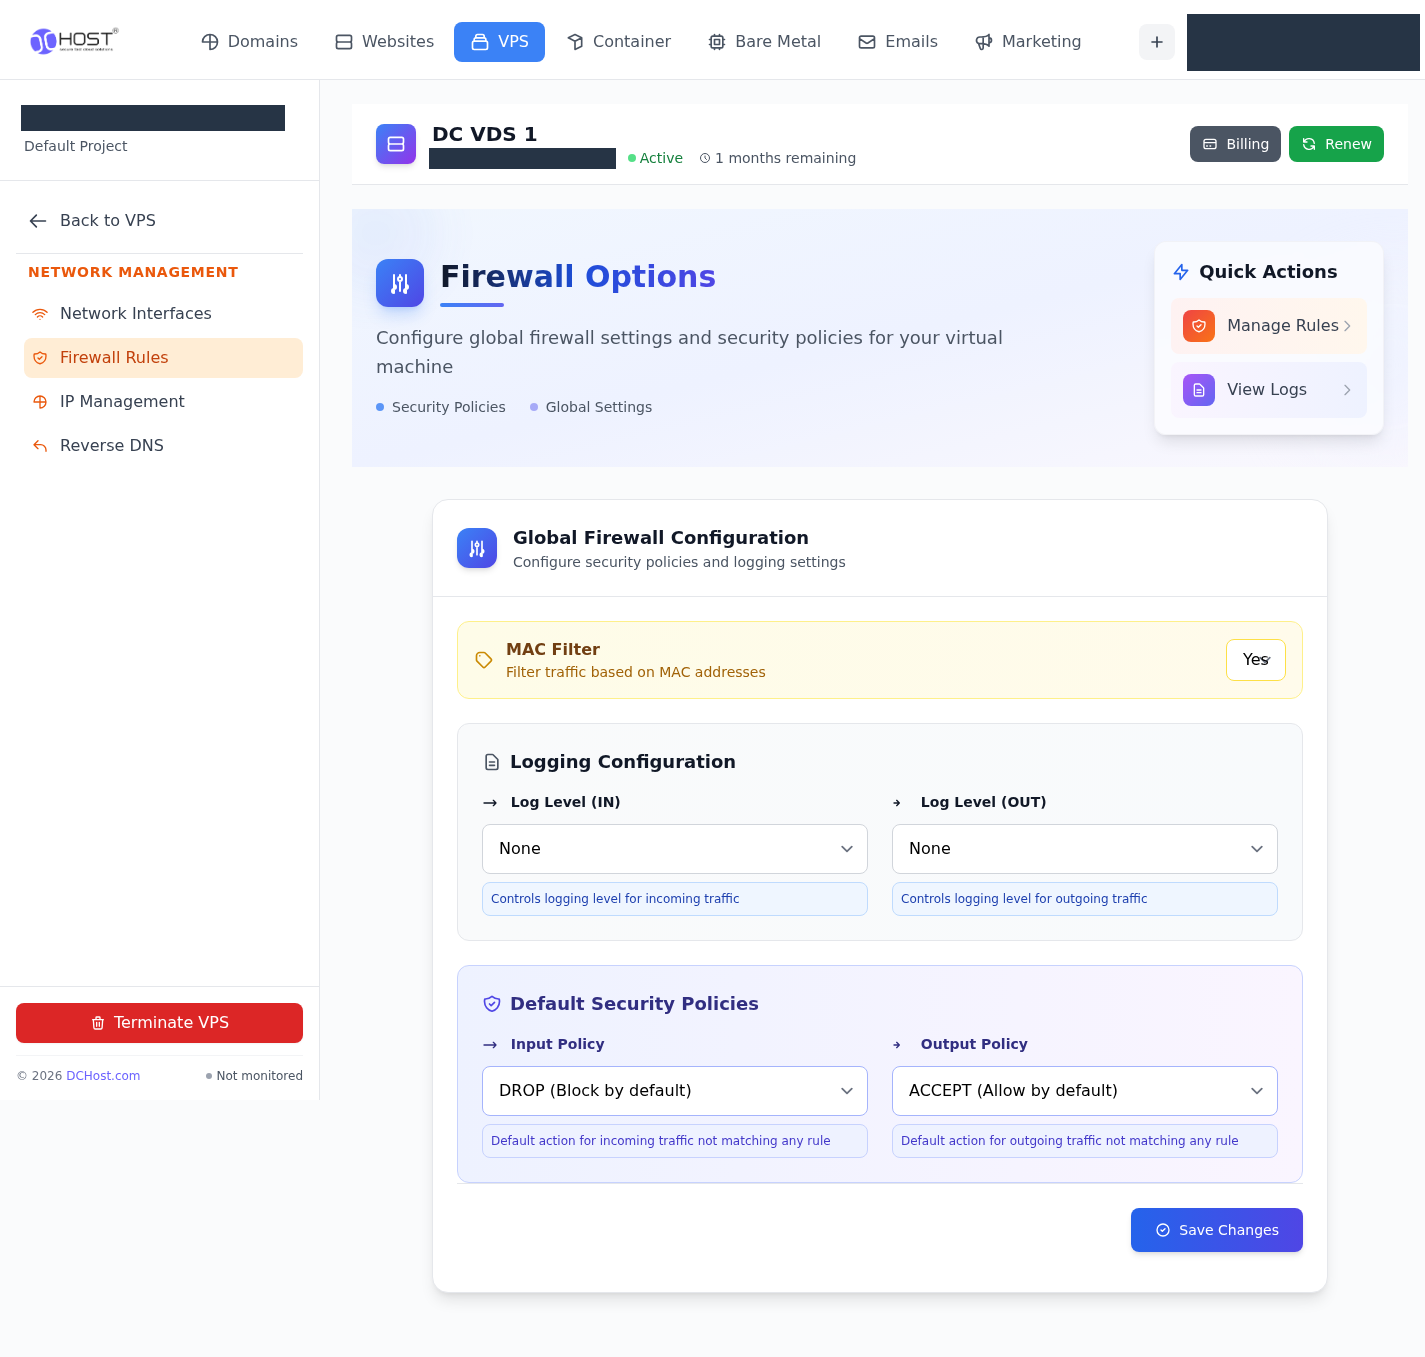
Options displays firewall options. Before changing one, check its current value and how it affects your access. For changes that affect SSH, make sure another usable access method is available.
Logging levels and default traffic policies appear in the same form.
Step 1: Check incoming traffic logging
- Check incoming traffic logging
Log Level (IN) controls incoming traffic logging. The adjacent Log Level (OUT) is for outgoing traffic.
- Read the default input policy
Input Policy applies to incoming traffic that matches no rule. Check Output Policy too.
- Identify the save button
Save Changes is below the form. No settings were changed and this button was not used for the guide.
Prepare another access method before changing a setting that affects your connection.
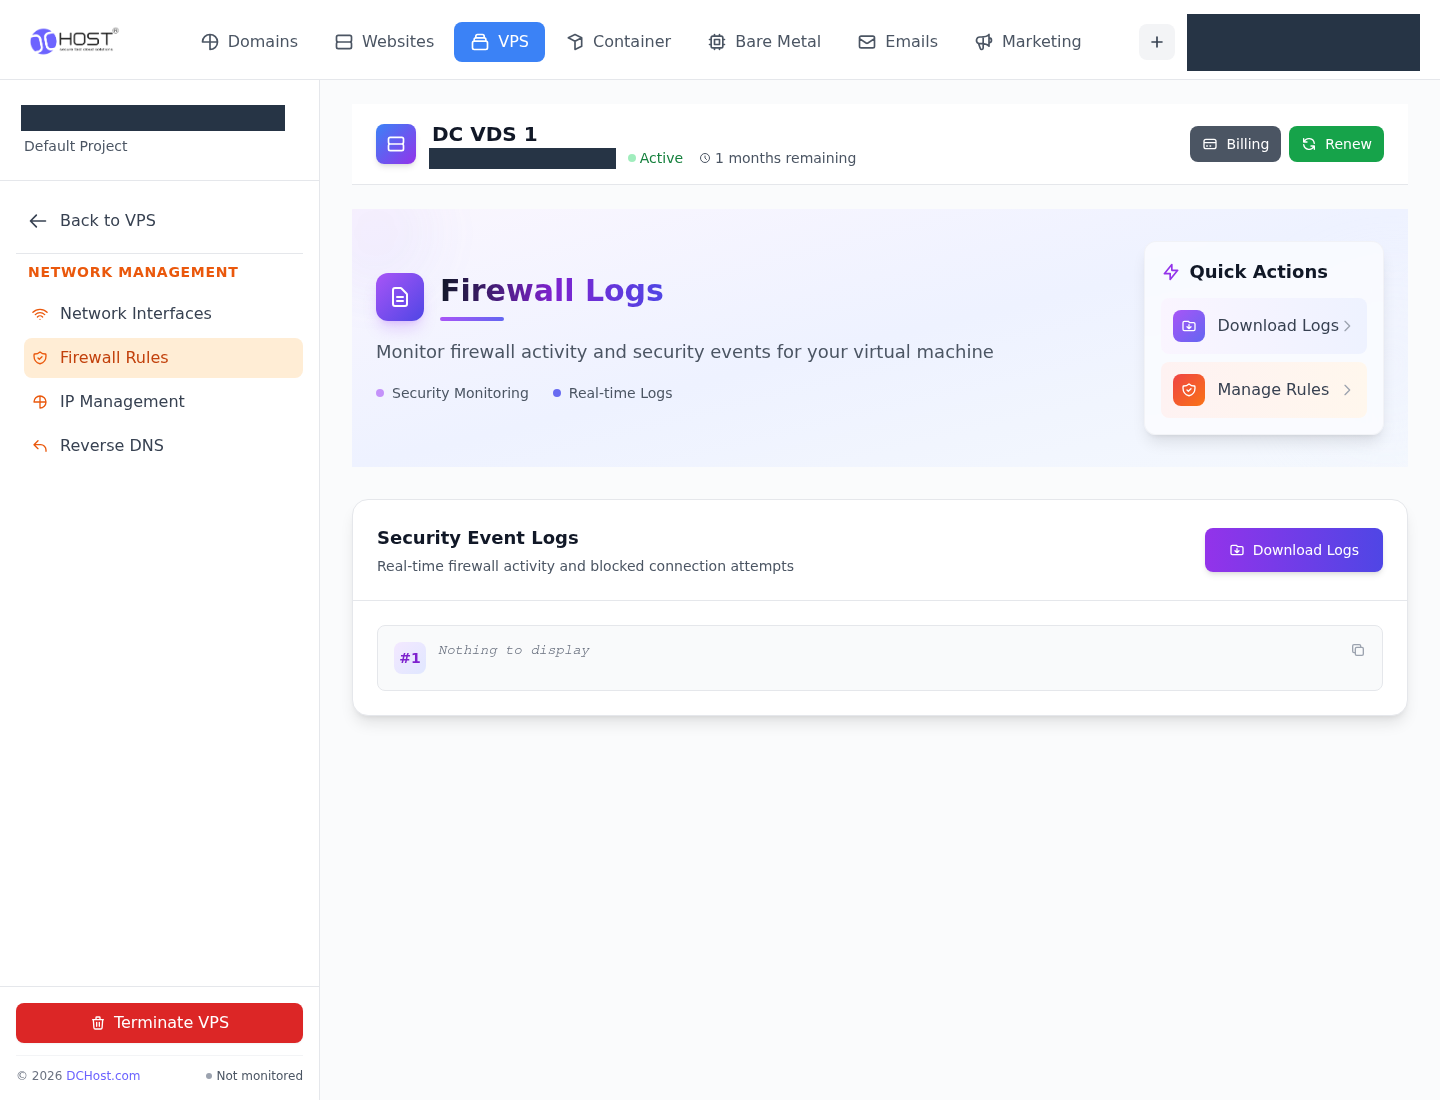
Use View Logs to inspect firewall records. Note the time of the problem and the connection's destination port when reviewing them. An empty log does not establish that traffic is allowed or that the firewall is disabled.
Review firewall records alongside the time of the connection problem.
Step 1: Locate the download control
- Locate the download control
Download Logs is available here. No log file was downloaded for this guide.
- Return to the rules
Use Manage Rules to review the relevant firewall rules again.
An empty log does not establish that traffic is allowed.
No rules were added or deleted, and no firewall options were changed for this guide. Use SSH connection errors to distinguish common connection failures.
Reverse DNS
Open Network Management → Reverse DNS. Reverse DNS looks up a hostname from an IP address. This differs from an A/AAAA record that points a domain name to an IP address. The screen opens a form with Update Reverse DNS.
Review the hostname to use for the IP address in this form.
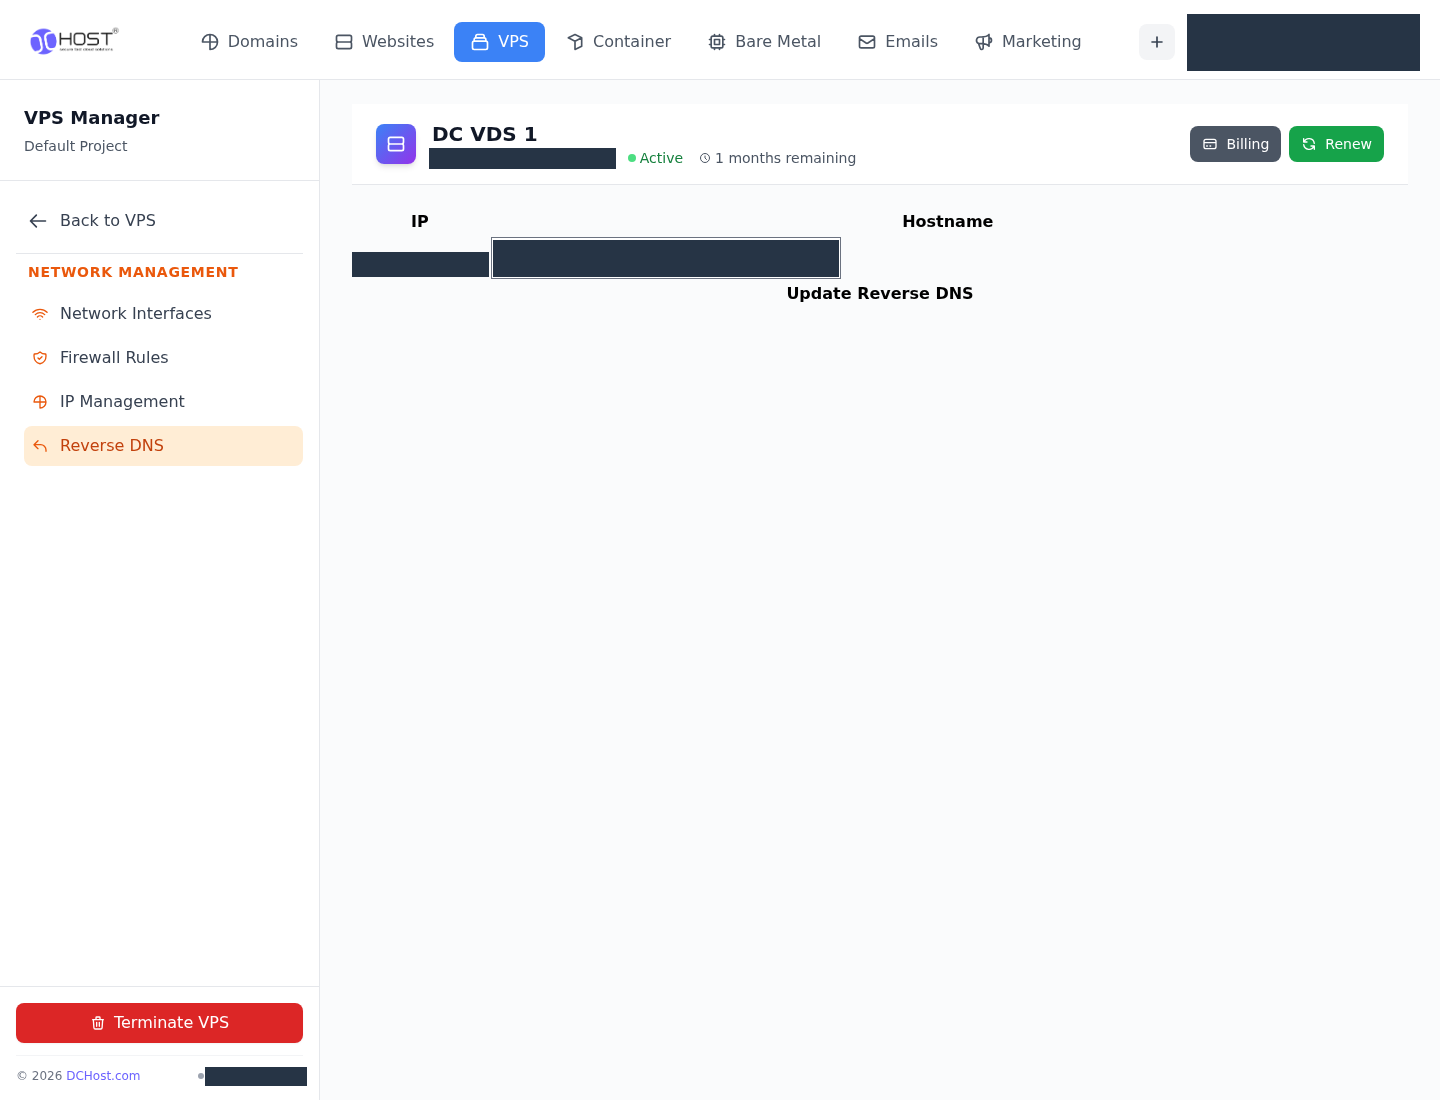
Step 1: Check the hostname
- Check the hostname
Check the fully qualified name in Hostname and its forward DNS record.
- Locate the update control
Update Reverse DNS is below the form. It was not used and no record was changed for this guide.
Reverse DNS differs from the A/AAAA record that points a domain name to an IP address.
If you need reverse DNS, identify the correct IP address and the fully qualified domain name to use, then check the hostname's forward DNS record too. Update Reverse DNS was not used and no record was changed for this guide. If you are preparing a mail server, also apply the SPF, DKIM and DMARC checks in email authentication.
Monitoring: resources, traffic and operation records
The Monitoring menu includes Resource Usage, Network traffic and System Logs.
Review the CPU, memory and disk I/O graphs together under Resource Usage. Check the displayed period and distinguish a brief spike from sustained resource pressure.
CPU, memory and disk I/O graphs show data on this screen.
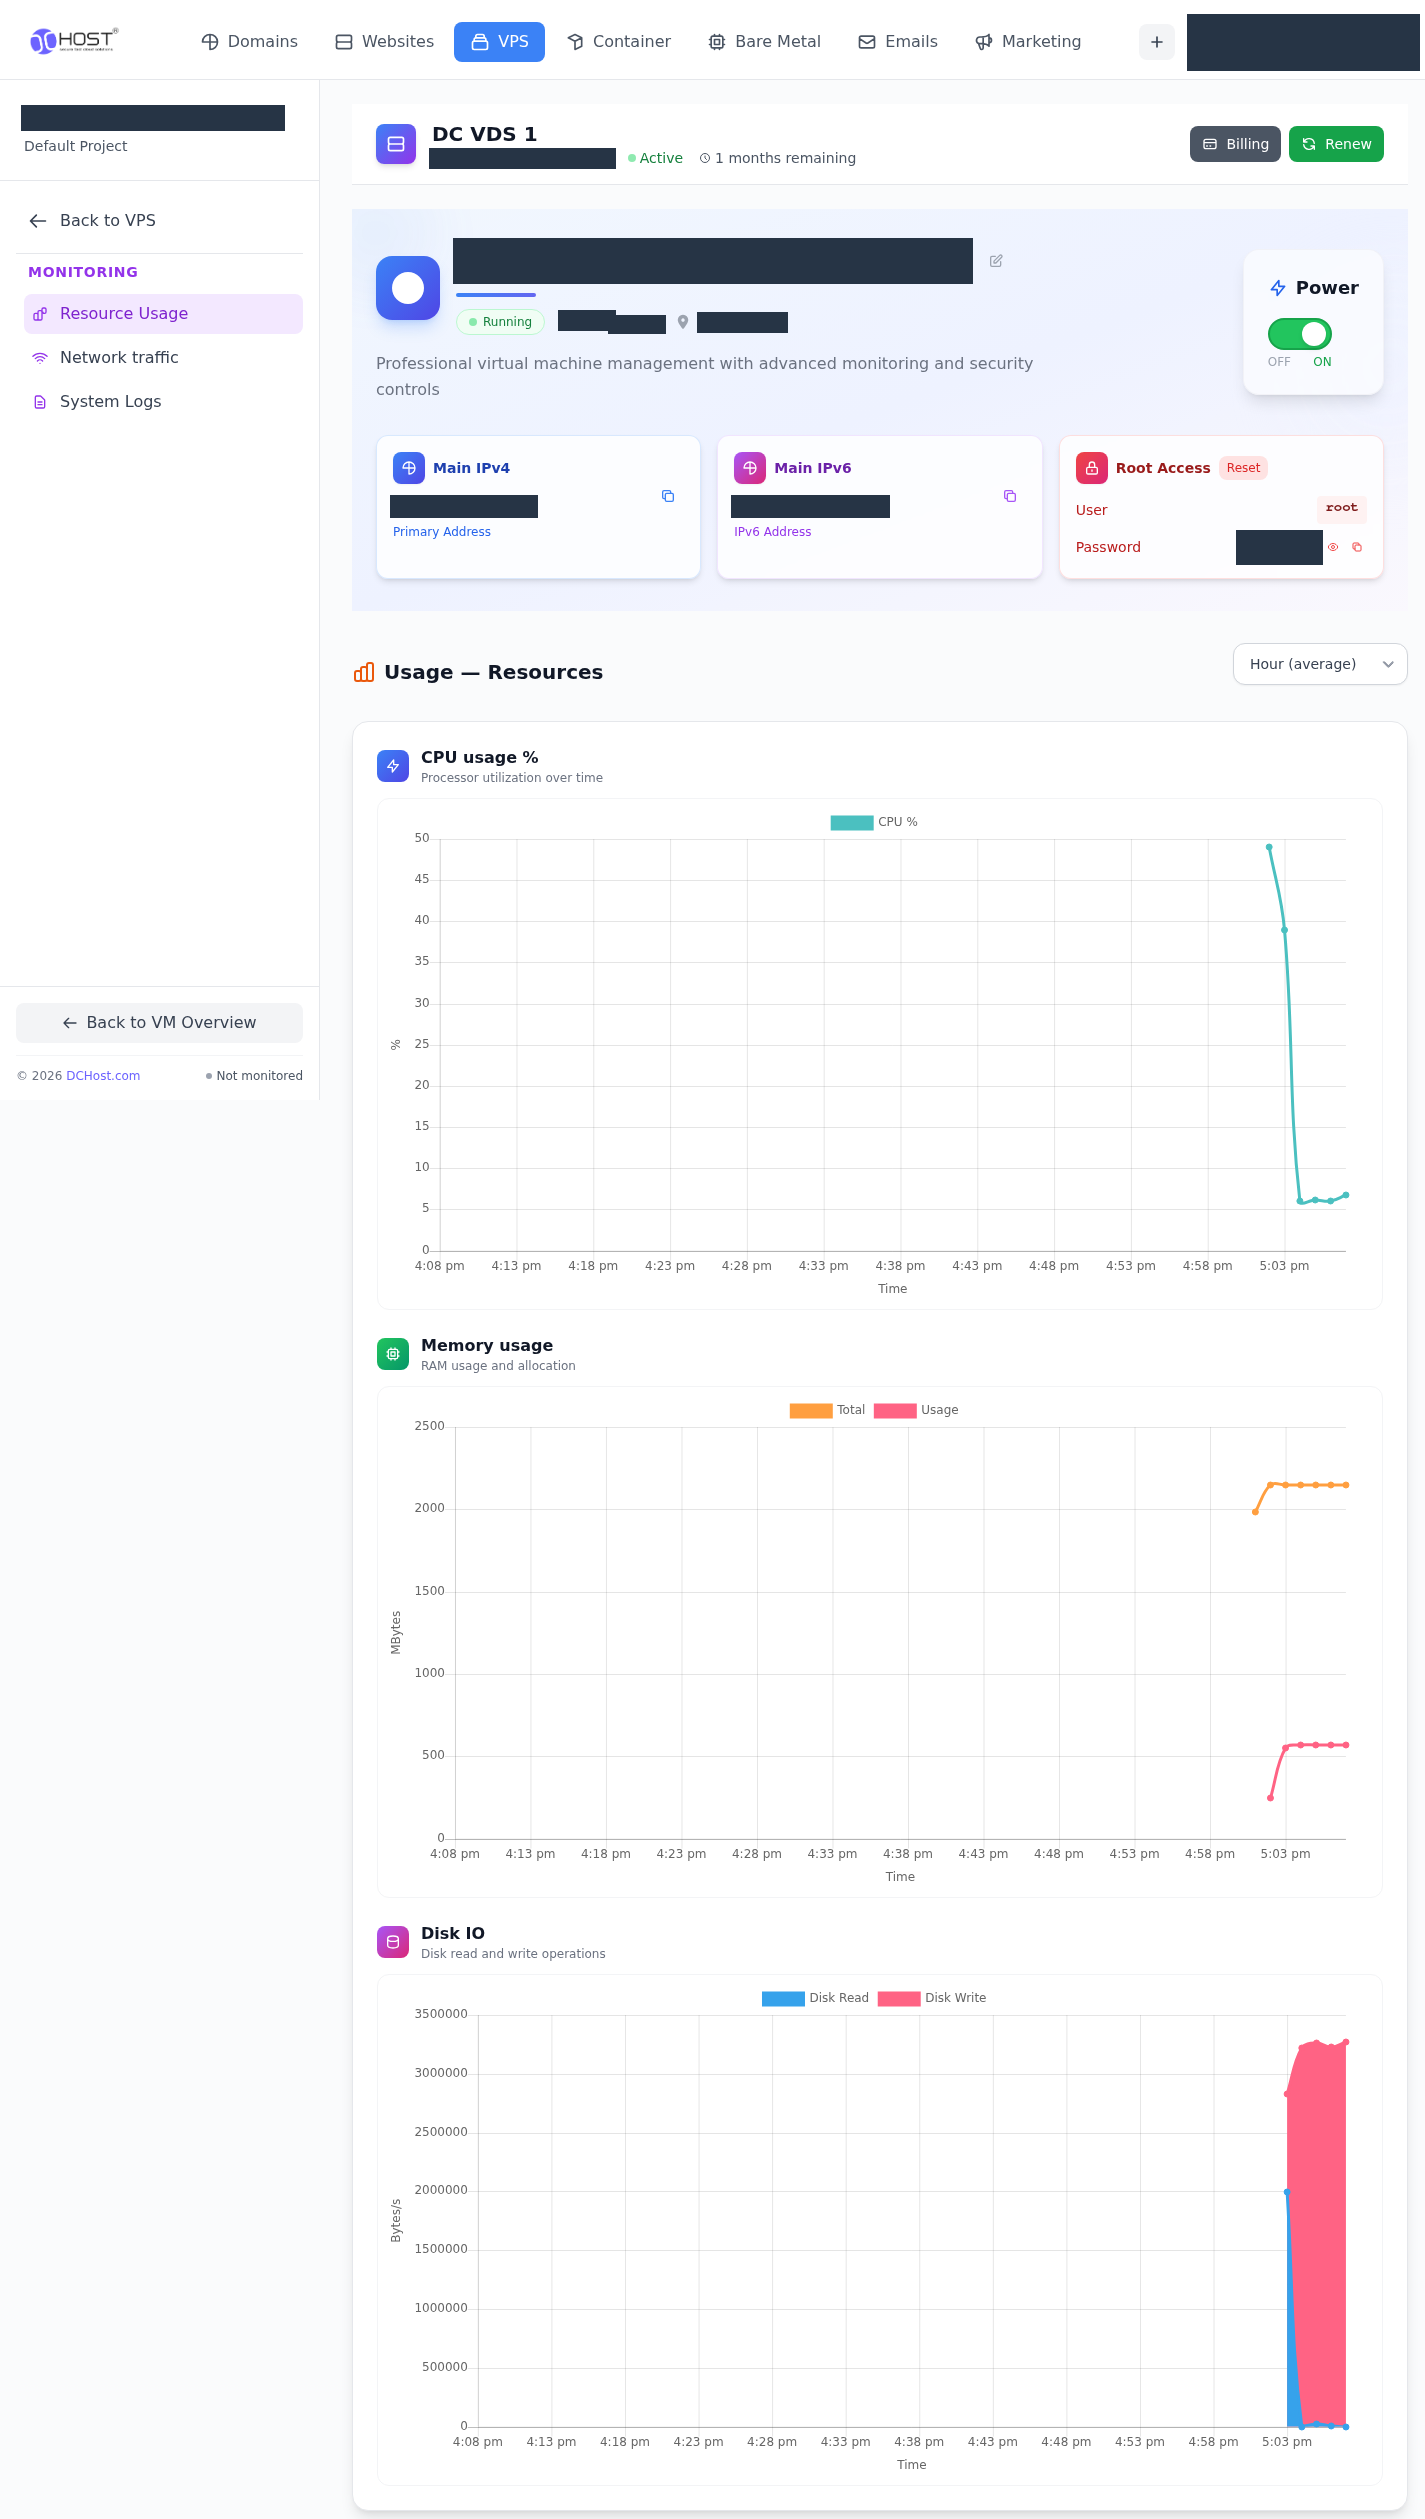
Step 1: Open resource usage
- Open resource usage
Select Resource Usage from the Monitoring menu.
- Check the graph period
The period selector offers average/max views for Hour, Day, Week, Month and Year.
Distinguish a brief spike from sustained resource pressure.
Open Network traffic to inspect network traffic. Compare the traffic data with the time of any connection problem.
The Net In and Net Out graph shows incoming and outgoing traffic data.
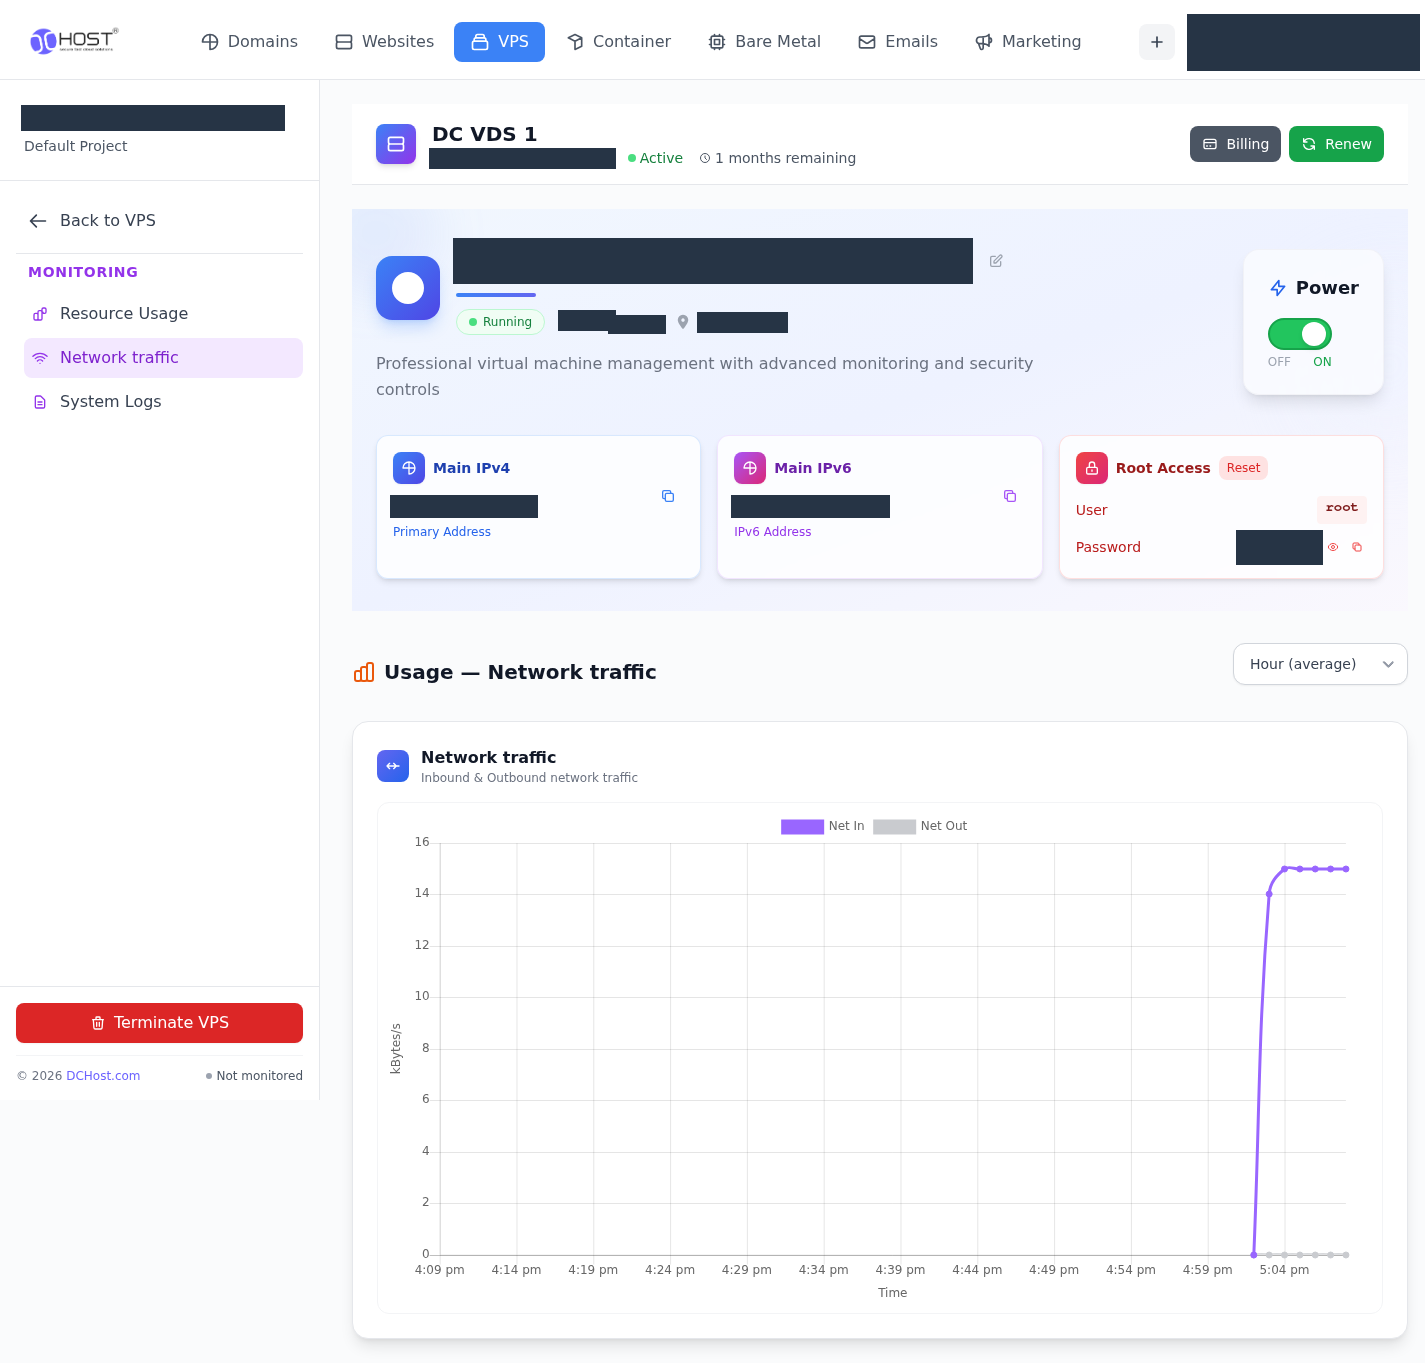
Step 1: Open the traffic screen
- Open the traffic screen
Use Network traffic in the Monitoring menu.
- Review the relevant period
Check the period selector and compare the graph with the time of the connection problem.
Traffic values alone do not establish that an application responded successfully.
System Logs opens portal operation history headed Logs → System activity and task history. The example screen shows VM Start, VM Configure and resize entries, each with an OK status and timestamp, plus a View All Events label. Do not treat this view as the operating system's logs. Include the relevant operation, status and time in a support request.
System activity and task history shows operation names and their results.
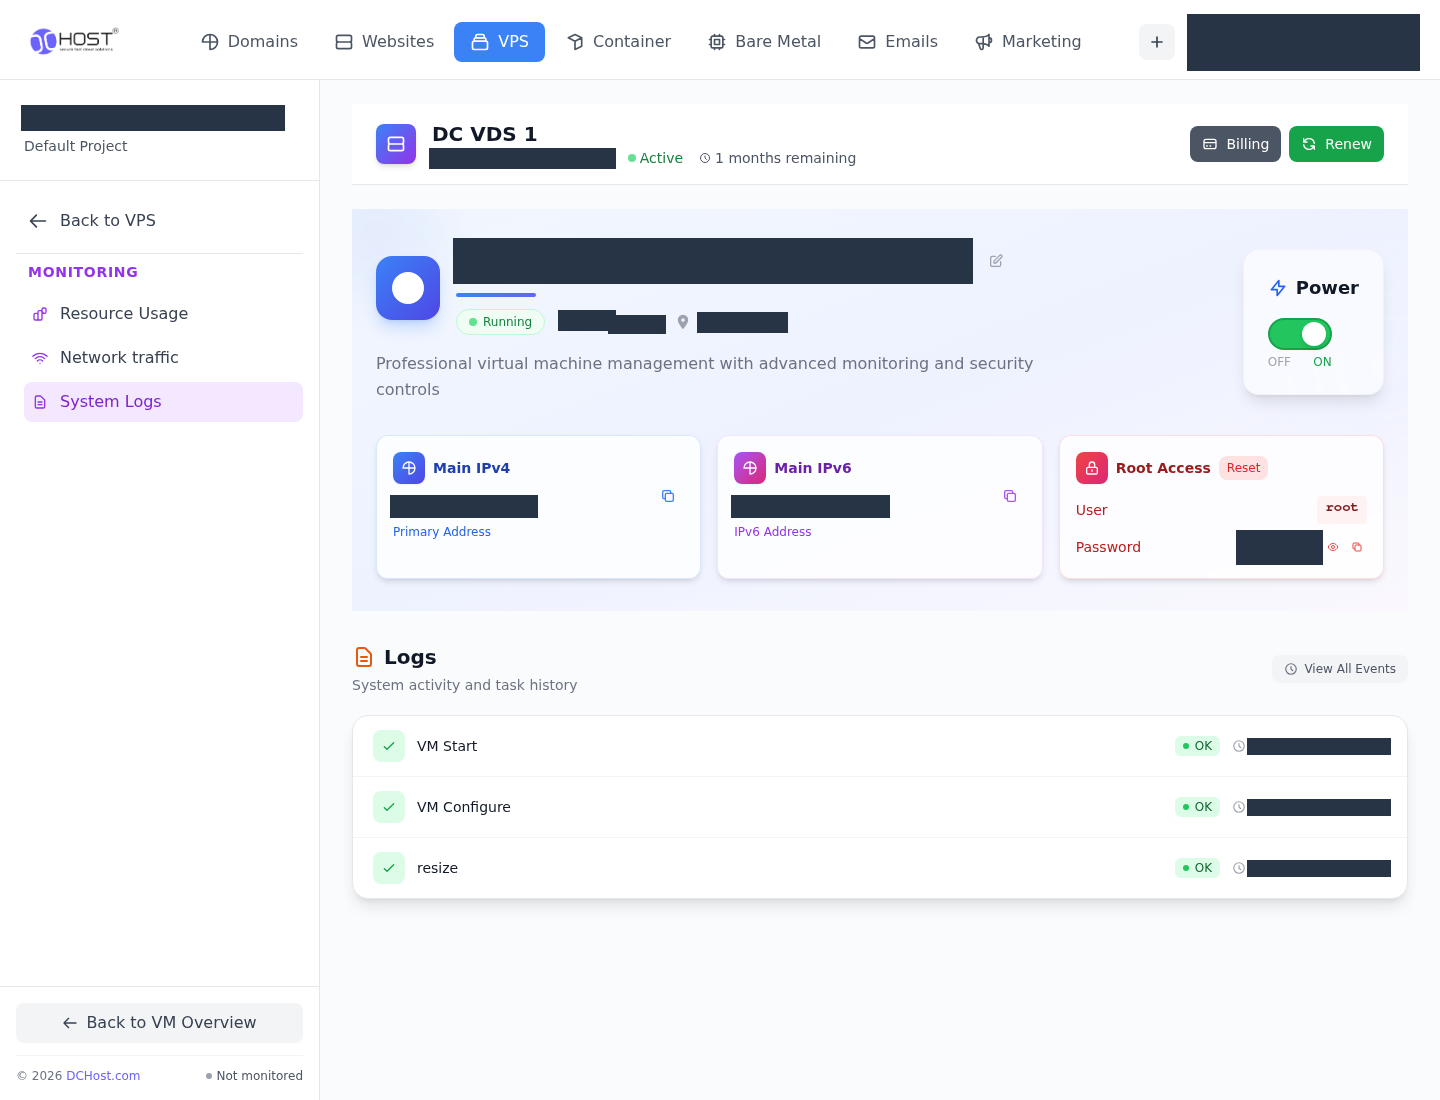
Step 1: Open operation history
- Open operation history
System Logs opens the Logs screen, showing VM Start, VM Configure and resize records.
This is portal operation history; it does not replace operating system logs.
Templates & ISO: ISO and template lists
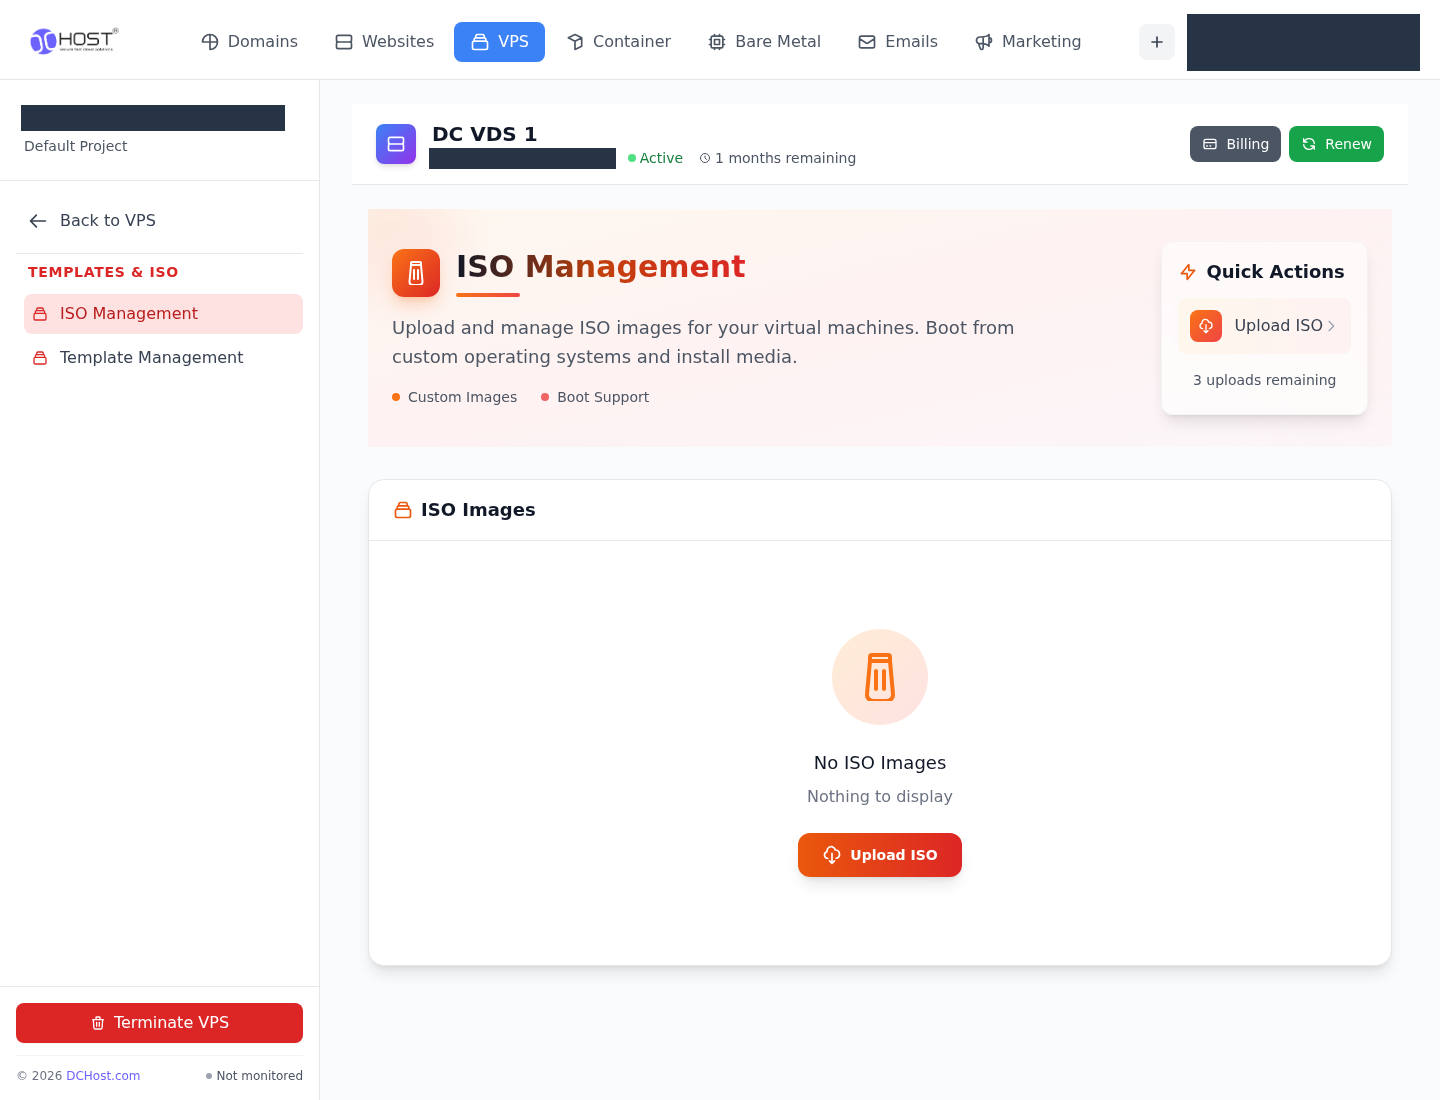
Templates & ISO opens ISO Management. The example service displays No ISO Images and Upload ISO controls; no ISO was uploaded.
Templates & ISO opens this screen; the example list shows No ISO Images.
Step 1: Select the ISO list
- Select the ISO list
Check that ISO Management is selected in the sidebar.
- Locate the upload control
Upload ISO appears at the upper right and in the empty list. It was not used for this guide.
No ISO Images means there are no ISO records in this list.
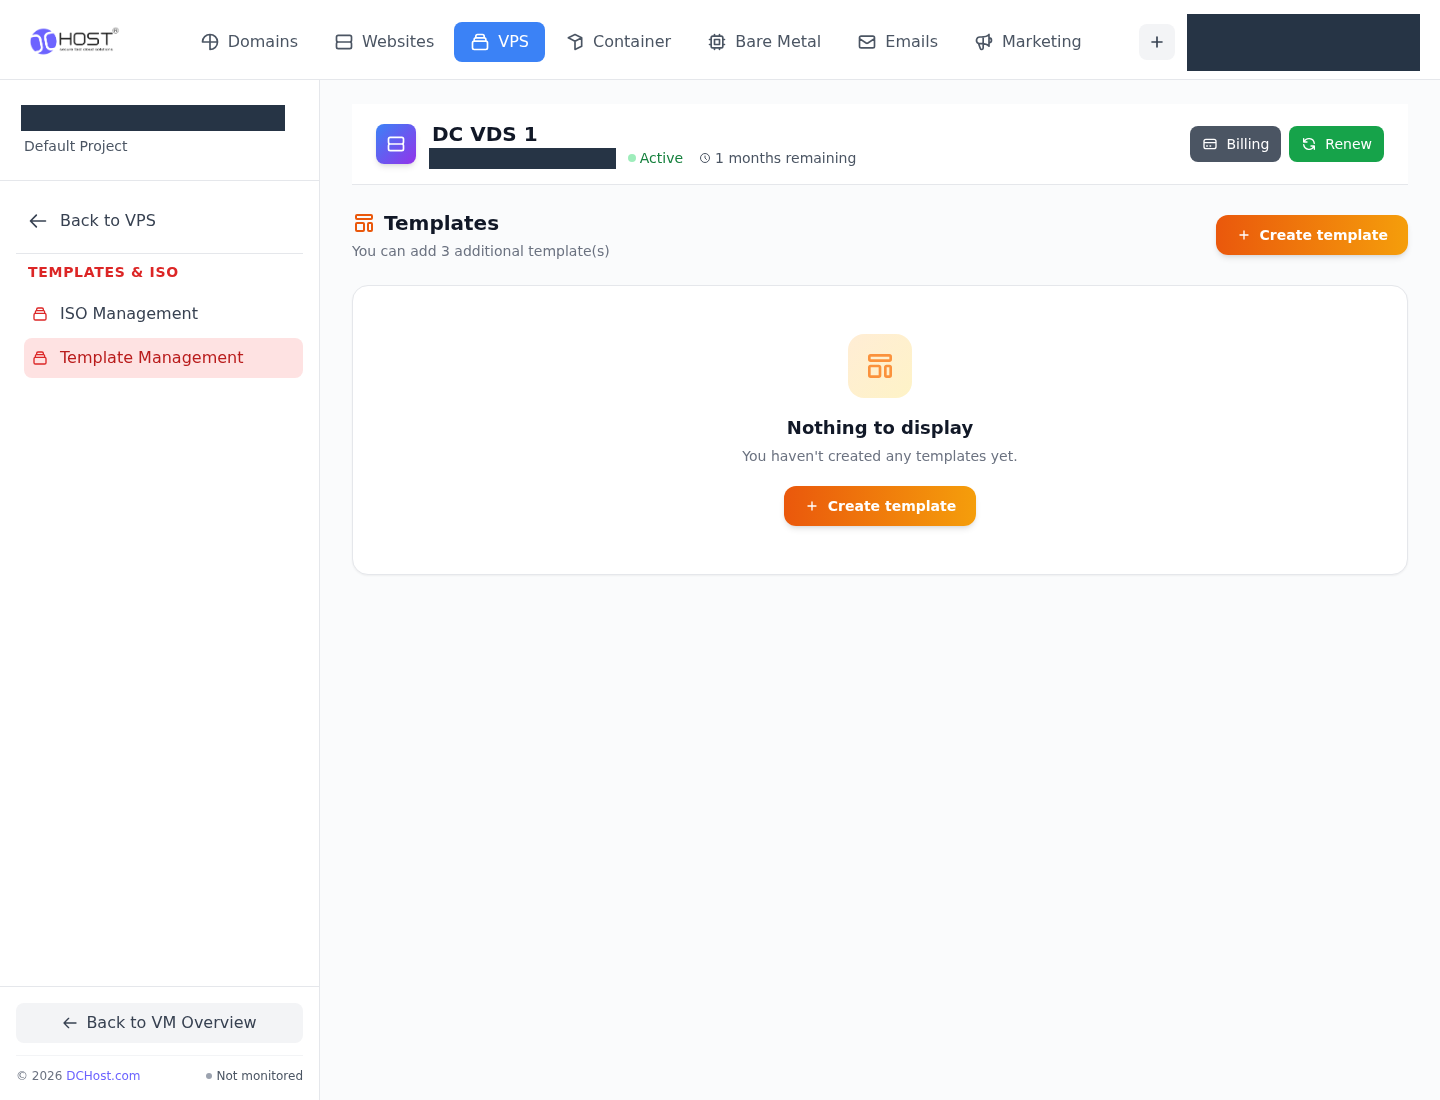
Template Management in the sidebar opens Templates. The example list shows Nothing to display and Create template links. Create template was not used for this guide.
Template Management opens the template list headed Templates.
Step 1: Select template management
- Select template management
Use Template Management in the sidebar to open the template list.
- Locate the empty-list control
Create template appears below Nothing to display; it was not used.
No template was created for this guide.
If screen information or access differs from what you expect
Check the project and service name first, then the selected tab. If resources or backup quota differ from what you expect, compare them with your ordered plan. If status information is inconsistent or you cannot connect, explain whether the issue appears only in the portal or also affects the server connection.
In a support request, include the service, affected section, displayed error or status text and approximate time. Hide passwords, private SSH keys and unnecessary personal information in screenshots.