Linux CPU at 100%: troubleshoot high load average and a slow VPS
Your VPS is very slow, Linux CPU usage reaches 100%, or load average stays high. First establish whether the processor cannot keep up, the application is waiting for another resource, or its own CPU quota is limiting it. Similar symptoms can have different causes.
This guide helps you find a Linux process using high CPU and choose an action that addresses the cause of slowness. A backup or data-processing job may legitimately use high CPU briefly and finish successfully. Lowering a percentage alone does not show that a customer's page or operation became faster.
Access required: An SSH connection and sudo privileges where indicated. Commands run on the Linux server you connected to. You can omit sudo when logged in as root. Inspection commands do not change configuration. Shared hosting users cannot manage the whole server; use cPanel resource checks for your own account's limits. For general RAM and disk checks, see server resource checks.
If SSH is unresponsive too, try the console in the DCHost customer portal. If the console is also unavailable, open a ticket with the service number and incident time; do not repeatedly restart the server just because load is high.
Screenshots come from a real demo VPS running Ubuntu 24.04 LTS with 1 vCPU. A finite test job ran in a service created only for this work, with time and resource limits. The same job is compared under two CPU quotas. This does not establish a customer application fault or a physical host capacity problem. You do not need to deliberately saturate your own processor to investigate an incident.
1. Are CPU percentage and load average the same?
No. CPU percentage describes how processor time was spent over a measurement interval. Load average describes the average load from runnable tasks and tasks in uninterruptible sleep. One is a time percentage; the other concerns the amount of work running or waiting.
Start by recording the time, available processing units and load:
date -Is
nproc
uptime
vmstat 1 5
nproc reports processing units available to this process; it does not prove that a physical core is dedicated to you or that the service has an unlimited CPU quota. CPU affinity, container limits and tool version can also matter. DCHost VPS/VDS use of Proxmox/KVM does not itself guarantee identical performance for every application.
The three load figures in uptime use 1, 5 and 15-minute time scales. Running tasks, tasks waiting for CPU, and tasks in D state, often associated with I/O waits, can contribute. The figures are not automatically divided by CPU count. Do not read load as a CPU percentage, or expect it to return to zero immediately after a short job finishes.
Check the available logical CPU count before interpreting load averages. This initial measurement was taken before the test.
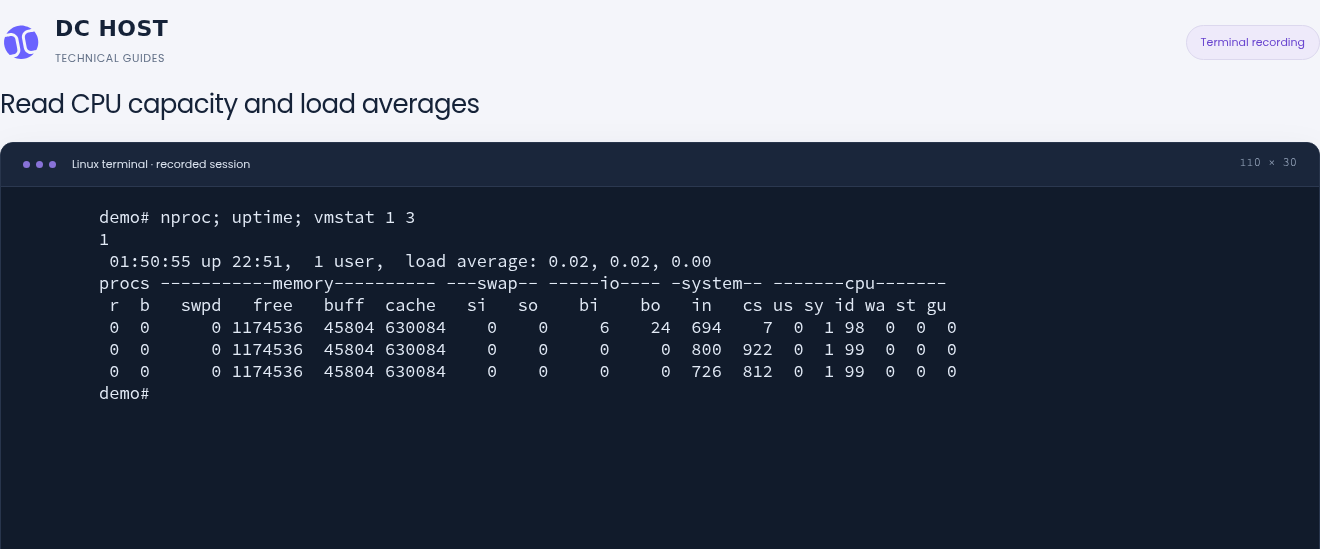
Step 1: Find the available CPU count
- Find the available CPU count
nproc reports 1 for this session. Consider both the CPU count and any service quota when assessing load.
- Separate the three time windows
The values cover the last 1, 5 and 15 minutes, respectively. This sample shows 0.02, 0.02 and 0.00.
Load average is not a CPU utilization percentage. It includes runnable tasks and tasks in uninterruptible sleep.
At baseline, nproc reported 1. Load was 0.02 / 0.02 / 0.00, and the next two vmstat interval samples showed 99% idle. These measurements were taken before the test job started; they are not universal targets for every server.
Which vmstat fields matter?
CPU and I/O rates in the first report cover the time since boot; subsequent reports cover one-second intervals. Process and memory fields are instantaneous. Read the later samples together for the current trend.
| Field | Meaning |
|---|---|
r | Running tasks and tasks waiting for CPU. Look for a sustained pattern rather than one high sample. |
b | Tasks blocked waiting for I/O to complete. |
us / sy | CPU time in user space and kernel space. vmstat includes nice user time in us. |
id | Idle CPU time. |
wa | I/O-wait accounting; it is not, by itself, a disk fault diagnosis or disk speed measurement. |
st | Time in which the VM could not run on CPU because of the virtualization layer; this is different from a CPU quota applied to your own service. |
The last two vmstat rows are one-second samples taken while the test job was running.
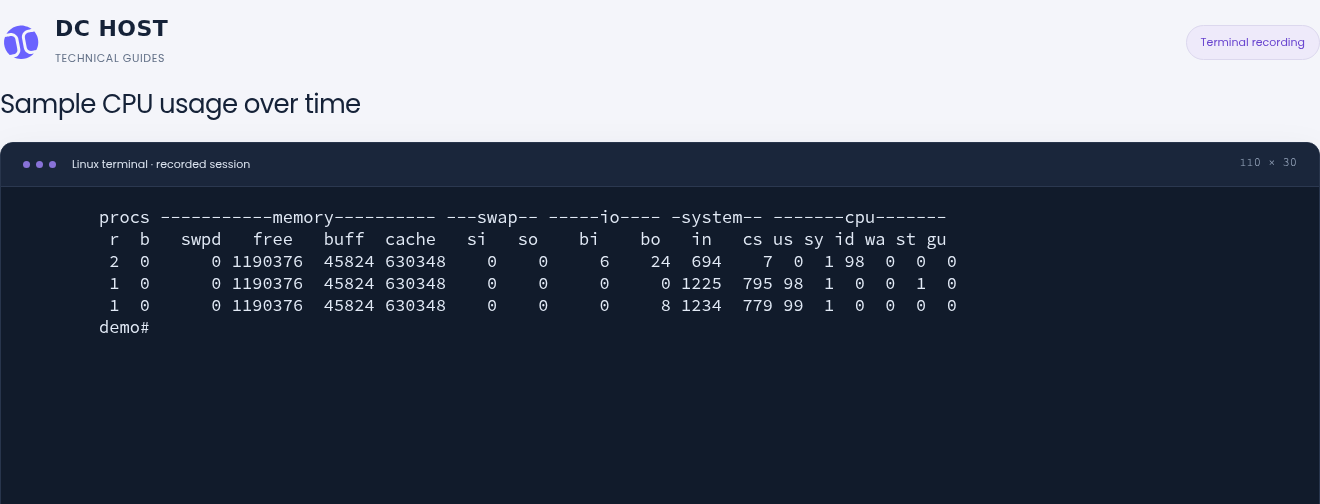
Step 1: Read the last two CPU samples
- Read the last two CPU samples
us is 98 and 99, sy is 1 and id is 0. The CPU is busy in these samples; one row is not a long-term conclusion.
- Distinguish r from b
r counts running or runnable tasks; b counts tasks blocked waiting for I/O. The last sample has r 1 and b 0.
Rates and CPU percentages in the first row are averages since boot; process and memory fields are not interpreted the same way. Later rows cover each sampling interval.
While the job ran under a 100% CPU quota, two subsequent one-second vmstat samples showed us=98% / 99%, sy=1%, id=0%. st was 1% and 0% in those samples. User time here includes the nice-priority demo job. Do not mix these intervals with the first, since-boot report.
2. Find the Linux process using CPU
Get an initial process list:
ps -eo pid,ppid,comm,etime,%cpu,%mem --sort=-%cpu | head -n 11
PID is the process ID, PPID identifies its parent, COMMAND is the program name and ELAPSED is how long it has been running. We show the program name instead of full command-line arguments; do not share access keys embedded in commands.
ps %CPU is CPU time divided by elapsed time over the process's lifetime. A long-running application that became busy only a few seconds ago may still appear low in this list. For usage over recent update intervals, continue with top:
top -d 1
- Wait for several refreshes; do not base the comparison solely on the first screen.
- Uppercase
Psorts tasks by CPU usage. 1toggles individual CPU summary lines when multiple processing units exist.qexitstopwithout stopping applications.
This is the second top sample, filtered to the demo process. It does not show the complete system process list.
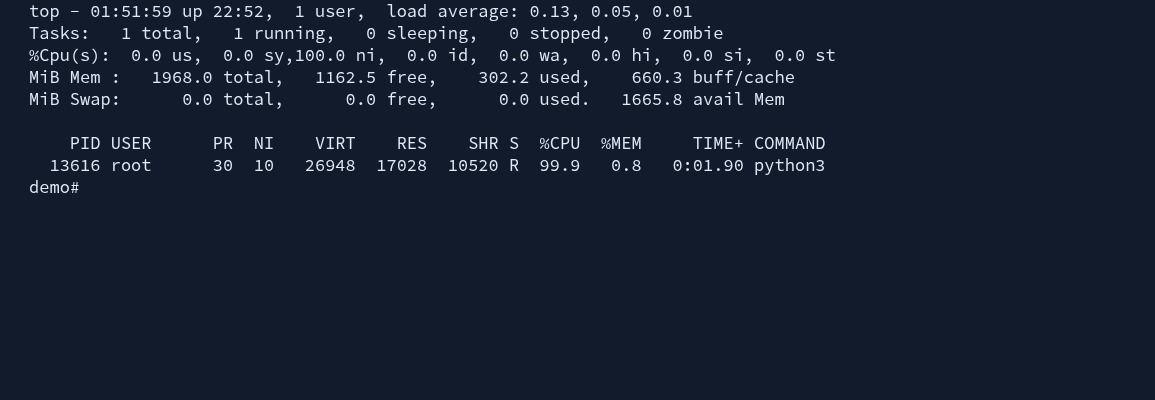
Step 1: Identify where CPU time is spent
- Identify where CPU time is spent
ni is 100.0. The demo runs with nice value 10, so its user-mode work appears here; id is 0.0 in this sample.
- Read CPU usage in the process row
The selected python3 process shows 99.9 percent. In top’s default Irix mode, 100 percent corresponds to one logical CPU.
These percentages describe this sample interval. The first top sample and earlier steal-time readings may differ.
The screenshot is filtered to the demo PID, not a list of all processes. The recording's second top update showed the demo process at 99.9% CPU, with the aggregate line showing ni=100% and id=0%. This measures a finite computation on 1 vCPU. Do not treat st in an earlier short first screen as though it covered the same interval as a later one-second sample.
How can a process use more than 100% CPU?
In its default Irix display, top treats one logical CPU as 100%. A multithreaded process running on several CPUs can exceed 100%. In Solaris mode the task percentage is divided by CPU count; uppercase I toggles between these display modes.
Do not give the aggregate %Cpu(s) line and a process's %CPU column the same denominator. For example, on a four-CPU system, one task fully occupying one CPU can represent roughly 25% of aggregate capacity. This illustrates the denominator only; the demo in this guide has 1 vCPU. Adding CPUs also does not automatically make every single-threaded operation parallel.
top shows nice user time separately as ni. The demo job uses Nice=10, so much of its CPU time appears in ni. A low us value does not mean the CPU is idle when ni is high. vmstat includes this nice user time in us. Nice changes relative scheduling priority; it is not a hard CPU cap and does not prevent a job using available CPU.
Match the process to the right application
Replace 1234 with the actual PID:
CHECK_PID=1234
ps -p "$CHECK_PID" -o pid,ppid,comm,etime,stat,%cpu,%mem
systemctl status "$CHECK_PID" --no-pager
Where systemd can associate the PID with a unit, systemctl status shows that service. Not every process has its own separate systemd service. The process may have finished, or the PID may have been reused; recheck its name and timing. The status command can also return a nonzero code because a unit is inactive, so do not infer a new fault from that code alone. systemctl status can include full command-line arguments and recent journal entries; redact private details before sharing it.
Confirm the PID, owner and systemd service identity rather than acting on the process name alone.
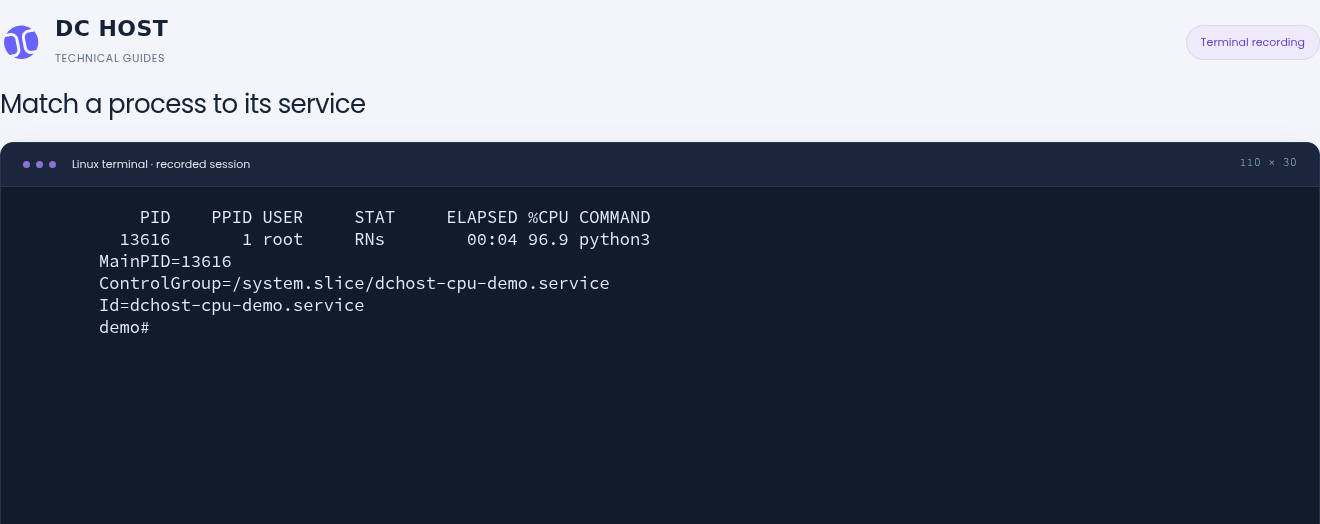
Step 1: Check that PID and MainPID match
- Check that PID and MainPID match
PID 13616 in ps matches MainPID from systemctl. This confirms which service is being inspected.
- Record the service name
Id is dchost-cpu-demo.service. On your own server, inspect logs and configuration through the service you have identified.
The 96.9 percent CPU value from ps is a lifetime average for the process; it is not directly equivalent to top’s latest interval sample.
In the demo, PID 13616 was matched to dchost-cpu-demo.service. Its ps lifetime average at that moment was 96.9%; it need not exactly match the earlier interval sample from top. In STAT, R indicated runnable state and N the lower nice priority.
Do not stop a database, backup or unknown process merely because it tops the list. Identify its work and the user operation that became slow first. A process name alone does not establish malware or an application defect.
3. What if load is high but CPU usage is low?
High load, low CPU does not necessarily point to insufficient processor capacity. Tasks contributing to load can be waiting for storage or another resource; an application can also be prevented from running by its CPU quota.
| Findings together | Next investigation |
|---|---|
High us / sy, low id, the same application repeatedly near the top | Application work, concurrency, queries and CPU capacity. Include nice user time when reading top. |
High load, notable b / wa, low application CPU use | I/O-waiting tasks, application and storage logs. wa alone does not mean the disk is faulty. |
| Low available RAM and sustained swap activity | RAM, OOM and swap investigation. |
| Spare overall CPU capacity and increasing service quota throttling | The service CPU limit. |
| Normal resource figures but one slow page or job | Application queries, locks, external APIs or network responses. Inspect the application's own logs. |
wa is particularly difficult to interpret on multiple CPUs; the kernel documentation explains limitations in this accounting. Not every D state means a faulty disk. Waiting for an external API response does not necessarily produce high wa either.
Read pressure stall information alongside the other measurements
Where supported, these files provide read-only measurements:
cat /proc/pressure/cpu
cat /proc/pressure/io
cat /proc/pressure/memory
PSI reports how much time tasks stall waiting for a resource. On the some line, avg10, avg60 and avg300 are stall percentages over 10, 60 and 300-second time scales; they are not CPU usage percentages. total is accumulated stall time in microseconds. A large lifetime total alone does not show current pressure.
System-wide CPU full is undefined and can appear as zero for compatibility; do not interpret it as proof that no CPU waiting occurs. If the files are absent, check kernel/environment support. Creating files or writing values into them is not part of this investigation.
PSI measures time during which tasks stall waiting for a resource. Read CPU, I/O and memory pressure separately.
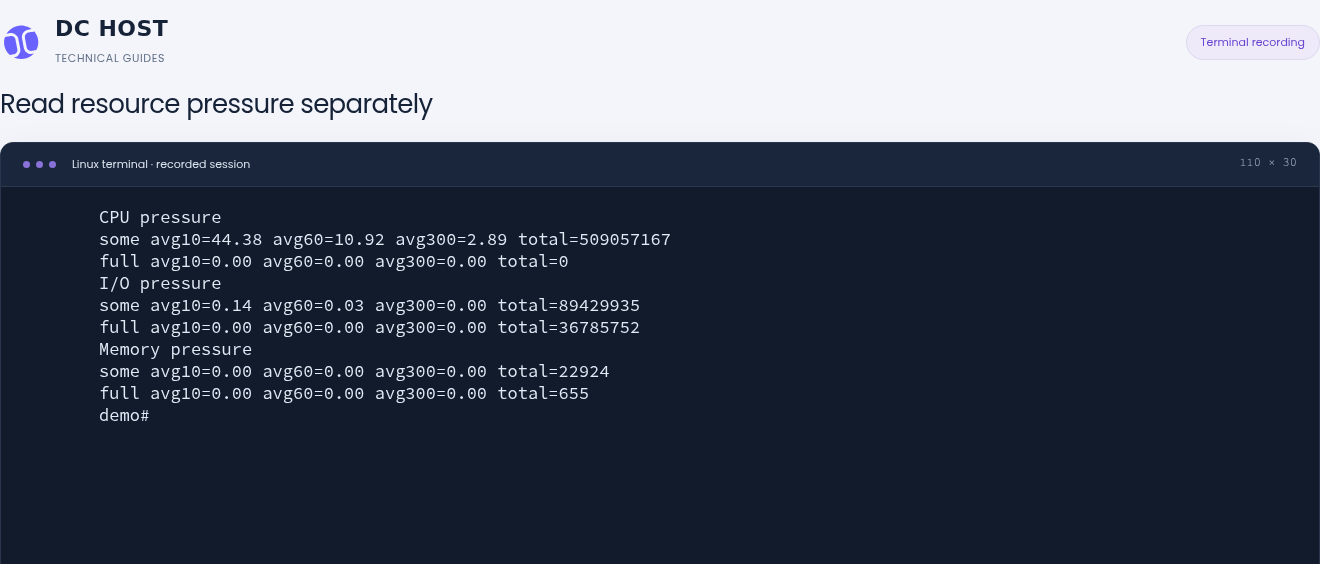
Step 1: Interpret CPU some correctly
- Interpret CPU some correctly
avg10 of 44.38 describes the share of time over the 10-second window when at least one task was waiting for CPU. It is not 44.38 percent CPU utilization.
- Compare each resource separately
At this instant I/O some avg10 is 0.14 and memory some avg10 is 0.00. Pressure for one resource is not another resource’s utilization percentage.
System-wide CPU full is not a meaningful metric. total is cumulative time; a zero recent average does not imply a zero historical total.
This system-wide sample taken while the 25%-quota job was running showed CPU some avg10=44.38; that does not mean CPU usage was 44.38%. I/O showed some avg10=0.14, and memory averages were zero, while historical I/O and memory total counters remained nonzero. These numbers alone do not diagnose a disk or physical host fault.
4. Distinguish CPU quota from VPS CPU steal
CPUQuota limits CPU time available to a particular service or container. CPU steal time (st) describes time in which the VM could not run on CPU because of the virtualization layer. They describe different layers and are not interchangeable.
If st stays high over repeated samples, record the times, measurements and application impact. A single spike does not prove a physical host fault or that neighbouring VMs are the cause. st=0 does not rule out every performance problem either.
Enter your actual service name and read its limits:
APP_UNIT=my-app.service
systemctl show "$APP_UNIT" \
  --property=LoadState,ActiveState,ControlGroup,CPUQuotaPerSecUSec,CPUQuotaPeriodUSec,CPUWeight
Correct the service name if LoadState=not-found. CPUQuotaPerSecUSec=250ms means a budget of at most 250 milliseconds of CPU time per second, or 25% of one CPU. CPUQuota=100% is one CPU's aggregate time budget, not 100% of an entire multi-CPU server. Processes in the service share the budget; it does not allocate a dedicated physical core to you.
CPUWeight influences relative shares between competing groups; it is not a percentage or a hard cap. A parent group's quota can also limit a child service. Assess limits against the needs of the application and other services on the server. [not set] means that the property has not been set explicitly for the unit; it does not mean zero CPU weight.
If CPU usage differs from expectations, check the service group’s limit. This first run has a 100 percent quota.
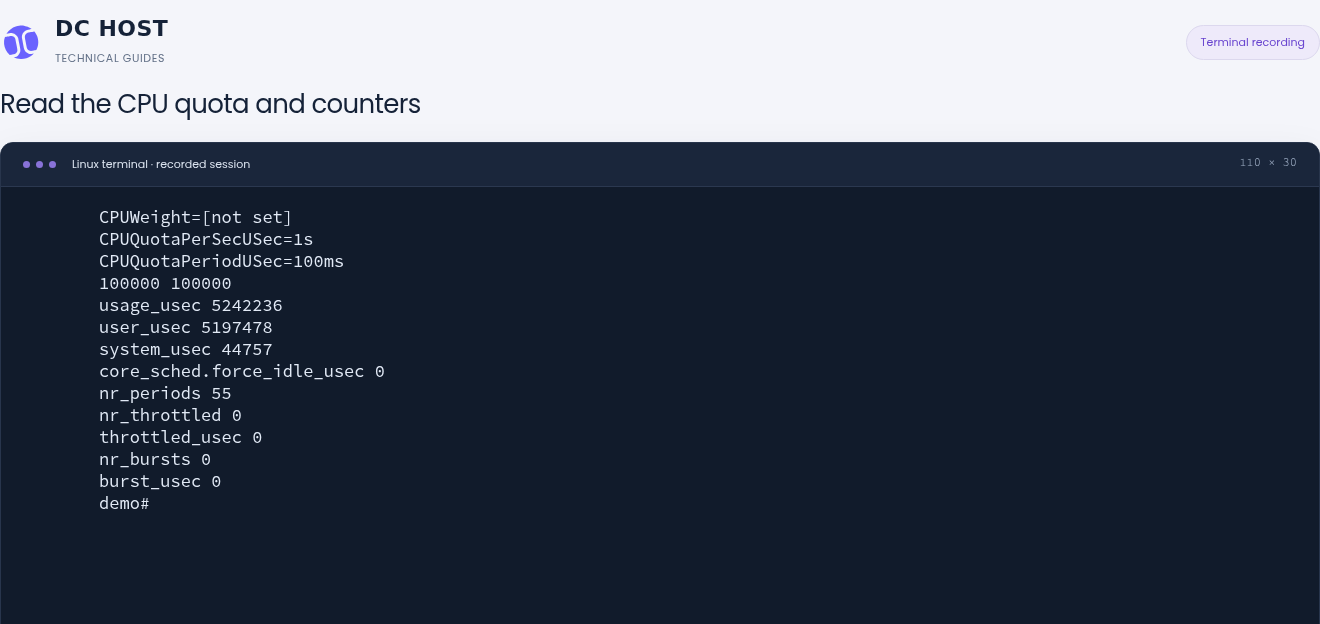
Step 1: Distinguish the two cpu.max values
- Distinguish the two cpu.max values
100000 100000 means a CPU budget of 100000 microseconds for each 100000-microsecond period: 100 percent of one logical CPU.
- Record the throttling counters
Here nr_periods is 55; nr_throttled and throttled_usec are 0. Compare these fields in the lower-quota run.
This check concerns only the demo service. Zero throttling counters at this instant do not describe other services or later samples.
The first demo service showed CPUQuotaPerSecUSec=1s, a 100ms period, and cpu.max=100000 100000 while its group existed. The second service used 250ms and 25000 100000 for 25%. These are the settings of two separate demo services.
Read cgroup v2 counters from the correct group
First obtain the service's actual group path. This block does not try to read the files when the path is empty or refers to the root group:
APP_CGROUP=$(systemctl show "$APP_UNIT" --property=ControlGroup --value)
printf 'ControlGroup=%s\n' "$APP_CGROUP"
if [ -n "$APP_CGROUP" ] && [ "$APP_CGROUP" != / ]; then
  sudo cat "/sys/fs/cgroup$APP_CGROUP/cpu.max"
  sudo cat "/sys/fs/cgroup$APP_CGROUP/cpu.stat"
fi
The path belongs to that running service in a cgroup v2 environment. Files may disappear after the service finishes and its group is removed. A missing cpu.max at the root cgroup is not necessarily a configuration error. Do not attribute counters from an arbitrary other group to your application.
| Field | How to read it |
|---|---|
cpu.max | Quota and period in microseconds. For example, 25000 100000 allows up to 25 ms of CPU time per 100 ms period. max means there is no finite quota at this group. |
usage_usec | Accumulated group CPU time, not the job's total elapsed wall time. |
nr_throttled | A counter of periods/events in which quota throttling occurred. It is not a CPU usage percentage. |
throttled_usec | Accumulated throttling time. Do not convert it directly into “this much application delay” without accounting for the interval and group scope. |
The same cgroup counters were read two seconds apart for the service with a 25 percent quota.
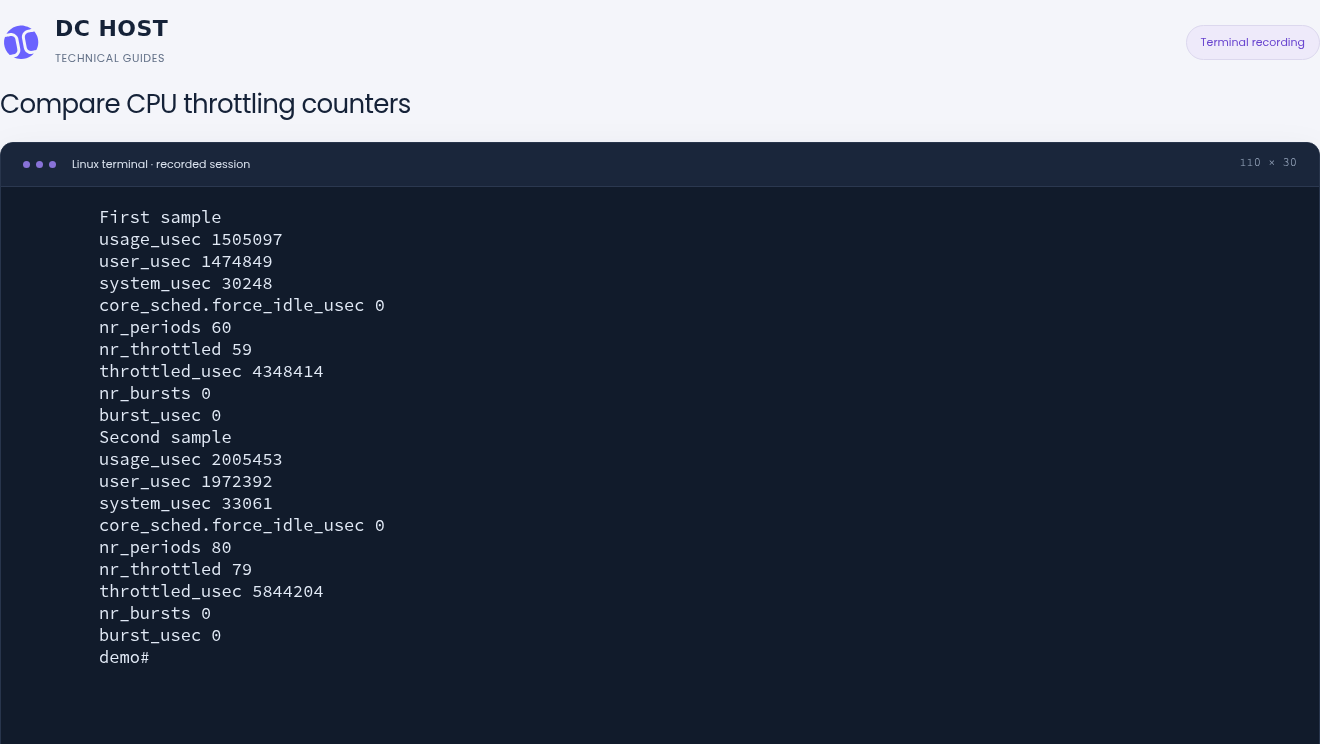
Step 1: Use the first sample as a reference
- Use the first sample as a reference
The first reading has nr_periods 60 and nr_throttled 59. throttled_usec is cumulative throttled time in microseconds.
- Compare the second sample
Two seconds later the values are 80 and 79. Their increase shows that this process group is reaching its configured CPU budget.
These counters show CPU quota enforcement for this service; they are not the server’s overall CPU utilization percentage.
Two samples taken two seconds apart from the same cgroup of the 25%-quota service showed nr_periods 60 → 80 and nr_throttled 59 → 79. usage_usec changed 1505097 → 2005453 and throttled_usec 4348414 → 5844204. These are cumulative counters for that group; we are not subtracting unrelated services' totals to compare performance.
Using roughly 0.50 seconds of CPU time over two seconds is consistent with this single-CPU, 25%-quota example. An increasing throttling counter does not itself mean a server fault; it shows the limit being applied.
This second run performs the same amount of work with a 25 percent CPU quota. The screen is the selected demo process’s second top sample.
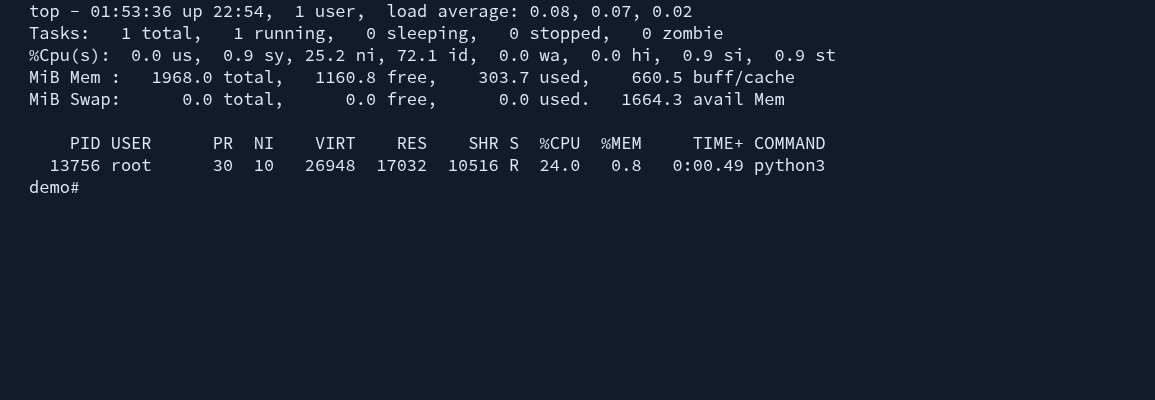
Step 1: A job can wait while CPU capacity is idle
- A job can wait while CPU capacity is idle
This sample has ni 25.2 and id 72.1. A service quota can limit the job’s CPU time even when the overall CPU has idle capacity.
- Measure process usage again
The demo process shows 24.0 percent CPU in this interval. A 25 percent quota does not guarantee exactly 25.0 percent in every short sample.
Lower utilization does not mean faster completion. Compare job duration after both runs finish.
In the 25%-quota job's second top interval sample, the process used 24.0% CPU while the aggregate line showed ni=25.2%, id=72.1% and st=0.9%. A server can show idle capacity while a particular job takes longer because of its own quota. These are individual samples; do not expect exactly 25% in every interval.
5. Does the load spike coincide with a backup or scheduled job?
If slowness returns at similar times each day, review backups, compression, antivirus scans, reports and updates. Matching times is a useful lead, not proof of causation.
systemctl list-timers --all --no-pager
crontab -l
In the timer list, LAST is the last trigger time and ACTIVATES names the unit started. This does not establish that the job completed successfully. Replace the name on the first line below with the actual service from ACTIVATES, then match its journal to the incident time:
JOB_UNIT=scheduled-job.service
sudo journalctl -u "$JOB_UNIT" --since "30 minutes ago" --no-pager
crontab -l shows only the current user's entries. “No crontab” does not mean the server has no scheduled work. Root's separate crontab, /etc/crontab, /etc/cron.d/, systemd timers and panel-managed tasks may also exist. The cPanel cron guide covers account-level jobs.
If CPU spikes recur at specific times, inspect systemd timers and cron jobs. This screen only reads the existing inventory.
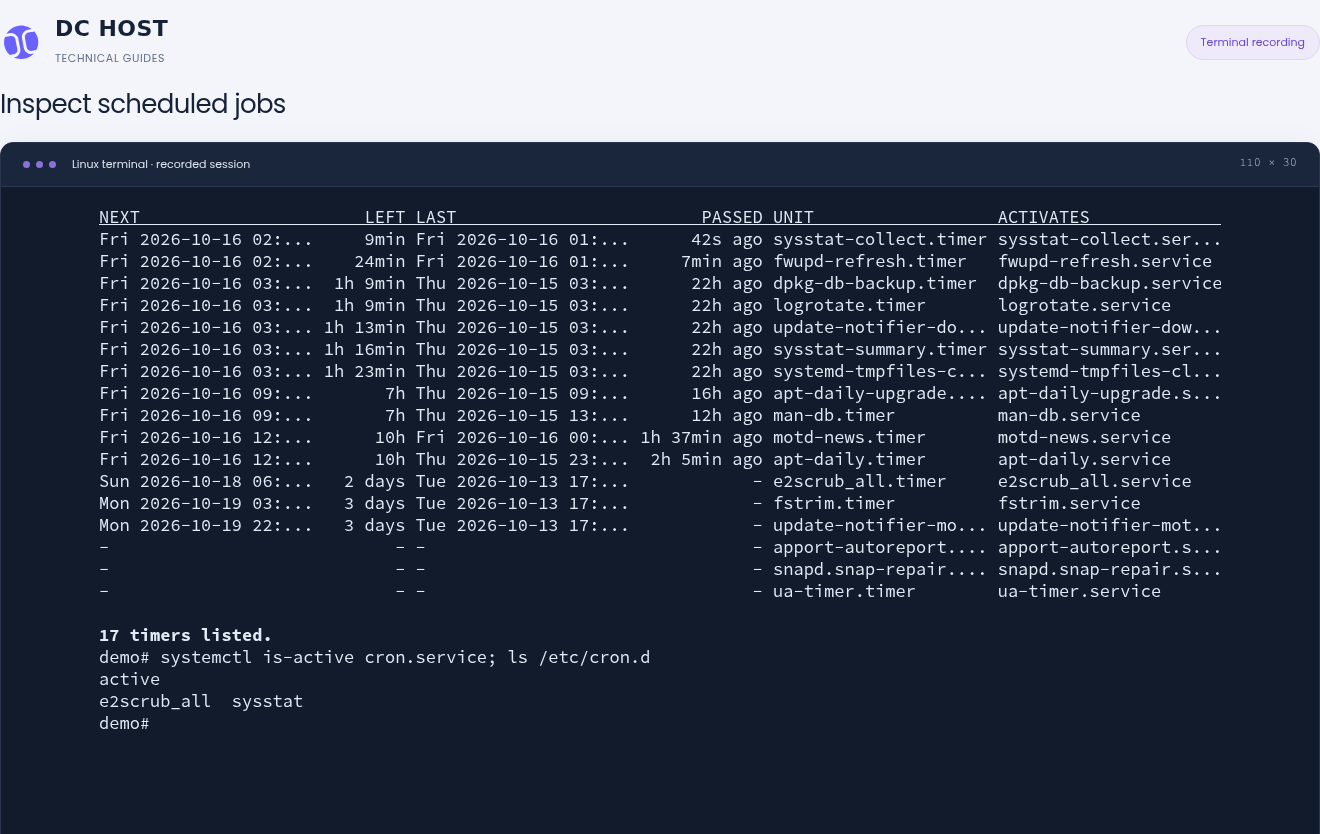
Step 1: Match the last trigger to the timer name
- Match the last trigger to the timer name
PASSED shows time since the last trigger and UNIT names the timer. Compare the suspected job with the incident time.
- Check cron as well
Cron reports active; cron.d contains e2scrub_all and sysstat files. This is an inventory, not evidence of causation.
Appearing in this list does not prove that a job caused a CPU spike. Compare the incident time with the relevant service logs.
The demo only read the timer list, cron.service status and file names in /etc/cron.d. Cron was active. A maintenance job appearing in the list does not show that it caused this CPU load; the guide's workload came from the separate, identified demo program.
Instead of cancelling backups, consider spreading jobs across different times and preventing overlapping runs of the same job. Preserve the intended timezone, backup window and application task settings. Do not disable updates, mail queues or security scans simply because they use CPU.
6. Improve the job's outcome, not just the CPU percentage
We ran the same fixed job under two CPU quotas. The input and amount of computation stayed the same; only the demo service's CPU time budget changed.
Both finite jobs have completed. The table compares actual worker measurements for the same six million iterations and verified service quotas.
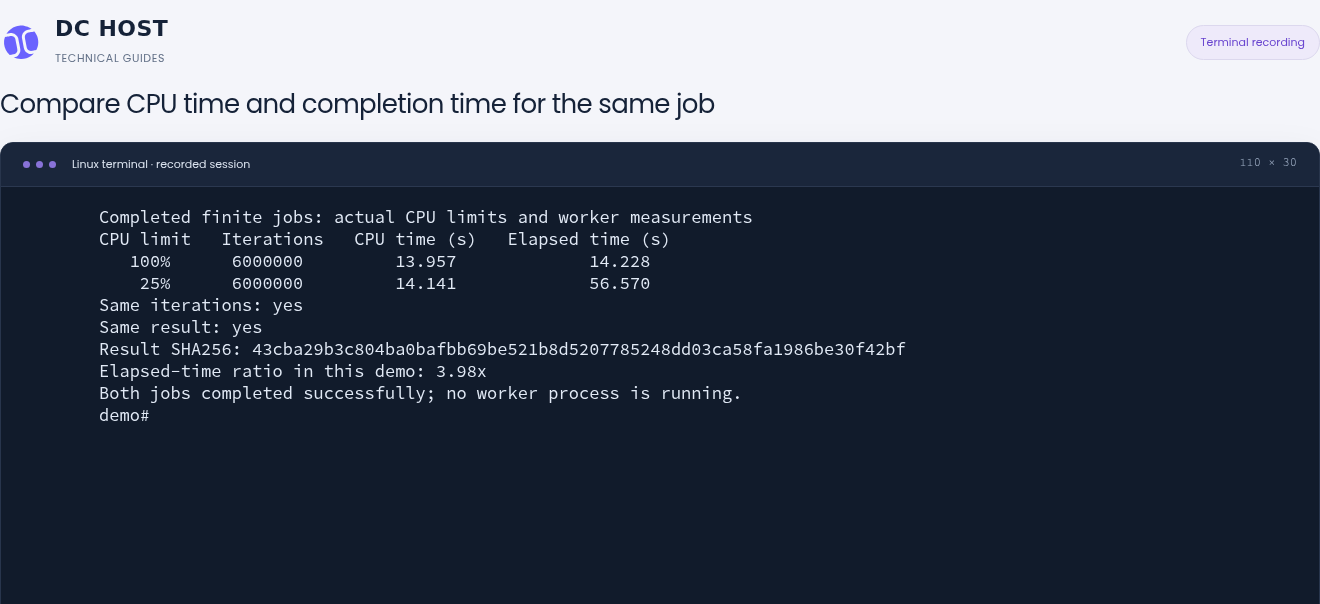
Step 1: Compare work amount and CPU time
- Compare work amount and CPU time
Both rows show 6000000 iterations. Time actually spent on CPU is 13.957 and 14.141 seconds, and the result is identical.
- Read the total time for the job to finish
Elapsed time runs from start to finish. Under the 25 percent quota this job takes 56.570 seconds; lower CPU usage does not make it finish sooner.
The elapsed-time ratio is 3.98 in this demo. It is not a performance promise for another application; it shows the effect of a smaller CPU budget on this workload.
Both runs completed 6,000,000 SHA-256 iterations with the same inputs, and their complete result digests matched exactly. The digest began 43cba29b3c80….
| Actual demo result | 100% CPU quota | 25% CPU quota |
|---|---|---|
| CPU time used by the test job | 13.957 seconds | 14.141 seconds |
| Elapsed time from start to finish | 14.228 seconds | 56.570 seconds |
| Iterations completed | 6,000,000 | 6,000,000 |
| Result digest | Identical | Identical |
| Service result | success, exit code 0 | success, exit code 0 |
Under the lower quota, the same job took approximately 3.98 times as long in this demo. That ratio is an observation from this test, not a general performance factor for every application. Work volume and concurrency were not reduced.
The demo units were oneshot services with RemainAfterExit. After completion they appeared active, but MainPID=0 meant the computation was no longer running. Empty cgroup paths had also been removed, so the comparison did not read a live cpu.max: it used recordings from during execution, loaded unit settings and the completed result files together.
The comparison illustrates why lower CPU usage alone does not mean better performance. Capping a background job can leave room for other work, but can also delay its completion. This demo did not measure a customer website becoming faster; verify the response of your own application separately.
| Cause identified | A change to consider |
|---|---|
| Too many concurrent worker processes | Reduce concurrency through the application's settings and check whether queue waiting time increases. |
| Backups, scans and reports overlap | Separate schedules, then verify that jobs still complete and backups remain usable. |
| One query or code path consumes excessive CPU | Inspect that operation using application logs and profiling. Do not apply random system-wide tuning. |
| A service quota is too small for its expected work | Record the current limit and other services' needs, then plan an appropriate budget. |
| Necessary normal workloads consistently exceed capacity | Consider upgrading the plan and check whether the application can use additional CPUs. |
Use the application's supported method and make a change whose impact you understand. kill -9, restarting the whole server or assigning every service the same quota is not a general optimization method. If work must be stopped, assess incomplete operations, databases and queues first; use the application's normal stop procedure and an appropriate maintenance window.
CPU activity and load averages were measured again after the two finite jobs completed.
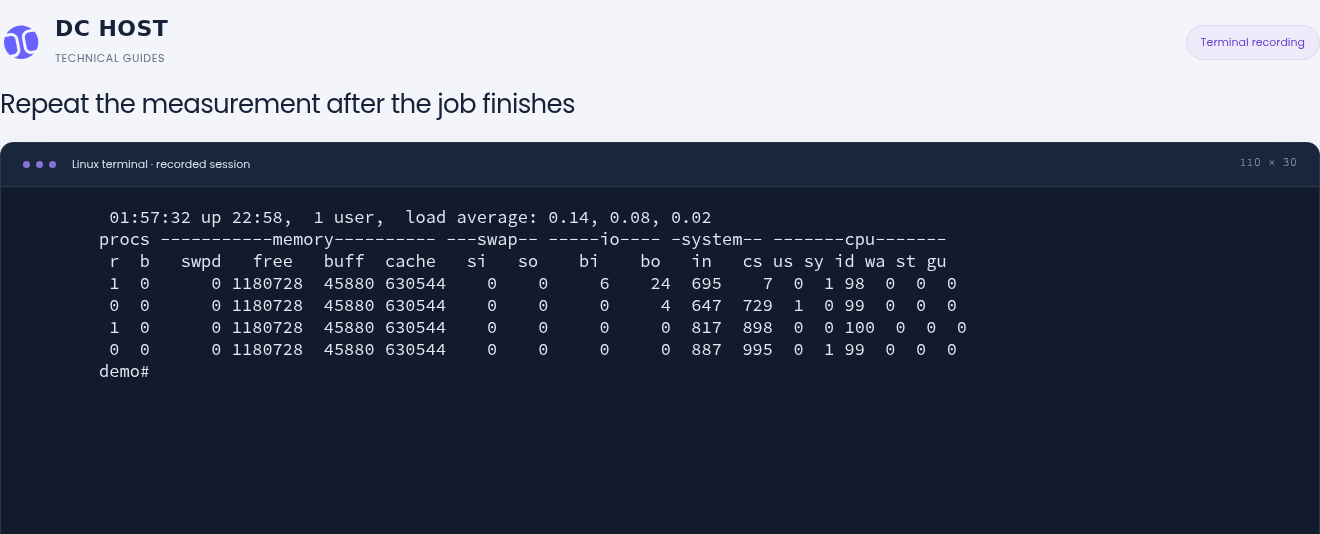
Step 1: Compare the later CPU intervals
- Compare the later CPU intervals
The id values after the initial average row are 99, 100 and 99. Most CPU time is idle during these intervals.
- Remember that load average reflects history
The one-, five- and fifteen-minute values are 0.14, 0.08 and 0.02. These averages need not fall to zero immediately when a job ends.
This idle-CPU measurement was taken after the finite jobs completed. Load average includes past activity; it is not the current CPU utilization percentage.
Interval samples taken after both jobs completed showed 99% / 100% / 99% idle CPU, while load remained 0.14 / 0.08 / 0.02. CPU fell because the jobs finished; this does not mean the lower quota made the work faster. Load averages need not immediately return to zero.
An actual comparison recorded after both jobs finished, lasting about 17 seconds. It reads the CPU quotas, CPU time and elapsed time for the same work. Playback is 1× with original timing preserved.
Recording transcript
This short recording is a real terminal comparison captured after both jobs completed. The displayed compare.py is a helper prepared for this demo that reads verified result files; it is not a file you should expect to find on your own server.
- Both demo services' successful results, zero exit codes and different CPU quotas are read.
- The completed-result summary confirms 6,000,000 iterations and identical result digests in both runs.
- CPU time and elapsed wall time are compared separately: the 25%-quota run took approximately 3.98 times as long in this example.
- Post-job
uptimeandvmstatmeasurements are read, showing that the CPU is largely idle again.
7. Recheck the same operation
Test the same page or job that was slow under comparable usage. Changing many settings at once makes it difficult to tell which change mattered.
- Did the job complete correctly and produce the intended data or output?
- What happened to user waiting time and application error counts?
- What do
top,vmstat, relevant quota counters and application logs show for the same interval? - Does CPU usage fall after work completes, and does load trend back down over time?
- Do other services and scheduled jobs continue to work?
The same basic checks were repeated after removing the temporary demo job files and services.
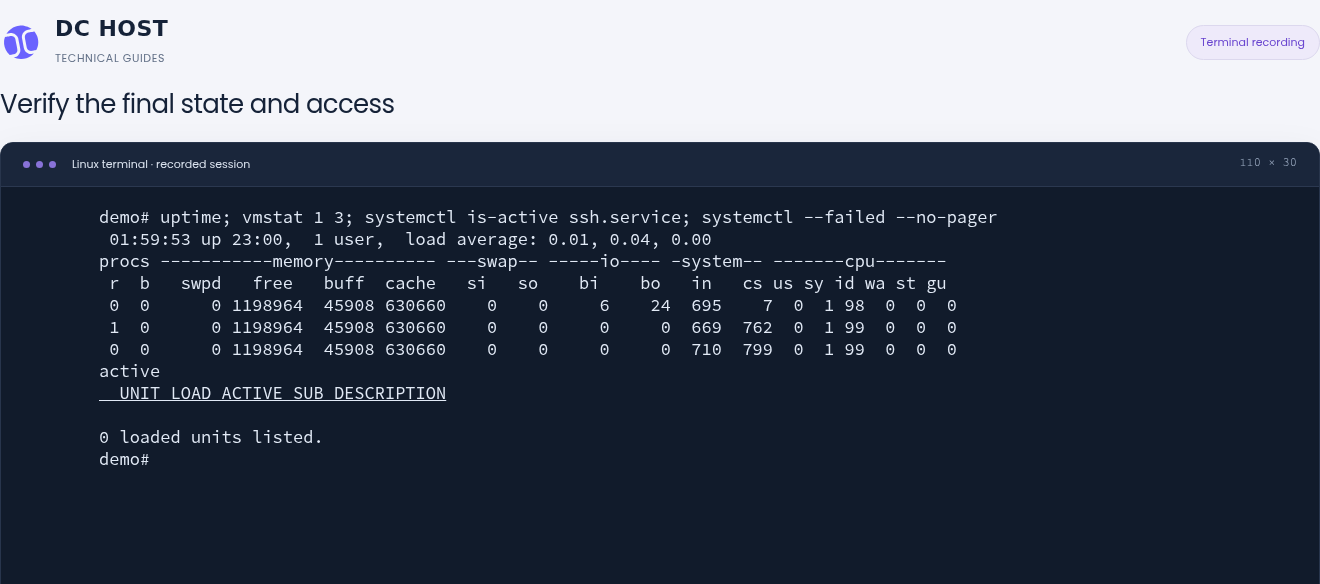
Step 1: Read the CPU state in the final intervals
- Read the CPU state in the final intervals
The last two samples have us 0, sy 1, id 99 and st 0. These values describe the final sampling intervals.
- Check SSH and the failed-unit list
SSH is active. systemctl --failed reports 0 loaded units listed; no failed unit appears in this check.
This is a point-in-time check after demo cleanup. Also measure your production application’s response time under its normal workload.
Before the final check, only files and the two temporary services created for this work were removed, with their contents verified before cleanup. Normal system journals remain.
The final screen showed load 0.01 / 0.04 / 0.00. The next two vmstat interval samples had us=0%, sy=1%, id=99%, wa=0%, st=0%. SSH was active and there were 0 failed systemd units. This records the demo's final state at that moment; verify the health of your own application separately.
Frequently asked questions
Does Linux CPU at 100% mean the server is faulty?
No. Using CPU when there is work to do is normal. Identify the job, how long it runs, whether it produces the expected result and whether other users are affected. Investigate when persistent saturation occurs together with delays.
Does high load average always mean insufficient CPU?
No. Tasks in uninterruptible sleep can contribute as well as runnable tasks. Read r, b, CPU fields, PSI and application logs together. Load is not a direct CPU percentage.
Why do ps and top show different CPU percentages?
ps divides lifetime CPU time by the process's elapsed lifetime. top reports tasks' usage over its most recent update interval; Irix/Solaris display mode and thread view also matter. Compare the same process and the same measurement interval.
What should I do if VPS CPU steal rises?
Collect several timestamped samples and the application impact, then share them with DCHost support along with the service number. One st sample does not establish a physical host fault or a neighbouring-VM cause. Check service quotas separately.
Will lowering a CPU quota make my VPS faster?
Not necessarily. It limits one job's CPU share and can leave room for others, but can make the capped job take longer. Assess quota, concurrency and application response together. Running the same job at 25% quota is not presented as a speed improvement here.
What if my VPS is slow but CPU usage looks normal?
Investigate memory pressure, I/O, application locks, database queries, networking and external services. The RAM/OOM and disk-full guides address separate issues; full storage and slow storage are also different problems.
When an external service call times out, separate DNS from connection and application response checks. A DNS answer containing an IP address does not by itself show that the destination port is reachable or that the application responds on time.
What should you send to support?
When opening a ticket in the DCHost customer portal, include the service number, incident time with timezone, affected operation and recent changes. A few CPU samples from the same interval, the process/service name, quota information and short relevant log excerpts help the investigation. Do not send passwords, private keys, access tokens or complete configuration files; mask IP addresses and private hostnames in public screenshots.